
Key Stats
How many XC40 did Volvo sell in 2025?
Volvo sold 4,331 XC40 in 2025. (From Jan - Mar 2025)
How many XC40 did Volvo sell in March 2025?
Volvo sold 2,704 XC40 in March 2025.
How many XC40 did Volvo sell in 2024?
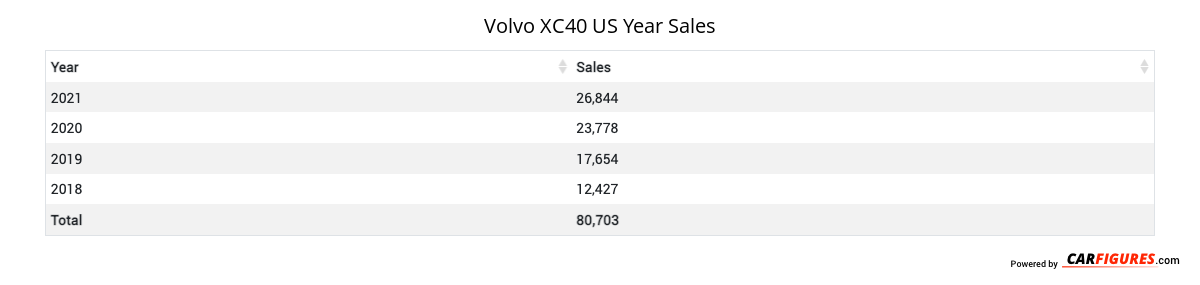
Volvo sold 3,811 XC40 in 2024. In 2023, Volvo sold 3,905 XC40. They sold 94 more units in year 2023 compared to 2024 with a percent loss of 2.41% YoY.
Overview
The 2024 Volvo XC40 is a vehicle from automaker Volvo.
How Much Does the 2024 Volvo XC40 Cost?
Pricing for the 2024 Volvo XC40 starts at $40,100 MSRP and goes up to $48,800 fully loaded.
Volvo XC40 Engine, Transmission, and Performance Numbers
Volvo XC40 is powered by a 2.0-liter engine with a All Wheel Drive powertrain that makes 247 -hp and 258 lb-ft torque. The transmission on the Volvo XC40 is an 8-Speed Geartronic Automatic.
List of Volvo XC40 Competitors
Some of Volvo XC40 competitors include the Volvo XC60 and BMW X1.
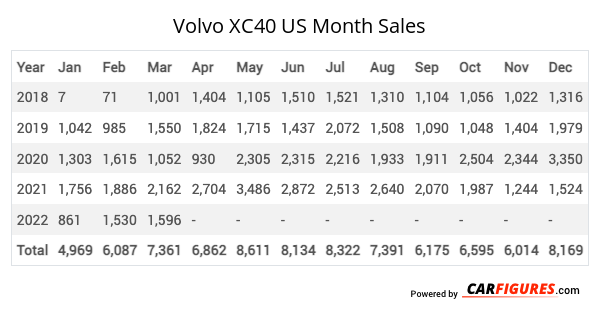
Volvo XC40 United States Sale figures by year, quarter, and month are presented below. Including the most up to date sales data for the Volvo XC40. See how the Volvo XC40 stacks up the other models in the Crossover/SUVS, Premium Subcompact Crossover/SUVs segments.
Year | Jan | Feb | Mar | Apr | May | Jun | Jul | Aug | Sep | Oct | Nov | Dec |
|---|---|---|---|---|---|---|---|---|---|---|---|---|
| 2018 | 7 | 71 | 1,001 | 1,404 | 1,105 | 1,510 | 1,521 | 1,310 | 1,104 | 1,056 | 1,022 | 1,316 |
| 2019 | 1,042 | 985 | 1,550 | 1,824 | 1,715 | 1,437 | 2,072 | 1,508 | 1,090 | 1,048 | 1,404 | 1,979 |
| 2020 | 1,303 | 1,615 | 1,052 | 930 | 2,305 | 2,315 | 2,216 | 1,933 | 1,911 | 2,504 | 2,344 | 3,350 |
| 2021 | 1,756 | 1,886 | 2,162 | 2,704 | 3,486 | 2,872 | 2,513 | 2,640 | 2,070 | 1,987 | 1,244 | 1,524 |
| 2022 | 861 | 1,530 | 1,596 | 1,312 | 1,836 | 1,686 | 0 | 0 | 974 | 0 | 0 | 2,767 |
| 2023 | 1,641 | 0 | 2,264 | 0 | 0 | 0 | 0 | 0 | 0 | 0 | 0 | 0 |
| 2024 | 2,096 | 0 | 0 | 0 | 0 | 0 | 0 | 0 | 1,715 | 0 | 0 | 0 |
| 2025 | - | 1,627 | 2,704 | - | - | - | - | - | - | - | - | - |
| Total | 8,706 | 7,714 | 12,329 | 8,174 | 10,447 | 9,820 | 8,322 | 7,391 | 8,864 | 6,595 | 6,014 | 10,936 |
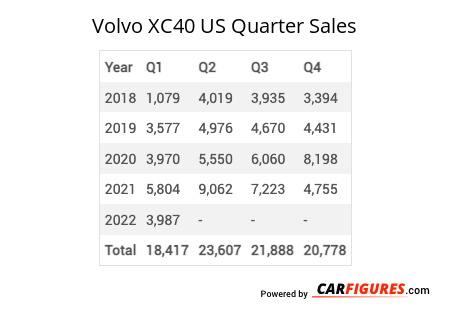
Year | Q1 | Q2 | Q3 | Q4 |
|---|---|---|---|---|
| 2018 | 1,079 | 4,019 | 3,935 | 3,394 |
| 2019 | 3,577 | 4,976 | 4,670 | 4,431 |
| 2020 | 3,970 | 5,550 | 6,060 | 8,198 |
| 2021 | 5,804 | 9,062 | 7,223 | 4,755 |
| 2022 | 3,987 | 4,834 | 974 | 2,767 |
| 2023 | 3,905 | 0 | 0 | 0 |
| 2024 | 2,096 | 0 | 1,715 | 0 |
| 2025 | 4,331 | - | - | - |
| Total | 28,749 | 28,441 | 24,577 | 23,545 |
Year | Sales |
|---|---|
| 2024 | 3,811 |
| 2023 | 3,905 |
| 2022 | 12,562 |
| 2021 | 26,844 |
| 2020 | 23,778 |
| 2019 | 17,654 |
| 2018 | 12,427 |
| Total | 100,981 |
Download Historic Sales Data
Embedded Code
See more widgetsSources: Manufacturers