Last updated: April 03, 2025
Key Stats
How many cars did Volvo sell in 2024?
Volvo sold 18,069 vehicles in 2024. In 2023, Volvo sold 17,923 vehicles. They sold 146 more vehicles in 2024 compared to 2023 with a percent gain of 0.81% YoY.
Volvo Total US Sales Statistics by Year
Volvo Total US Sales Statistics by Quarter
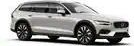
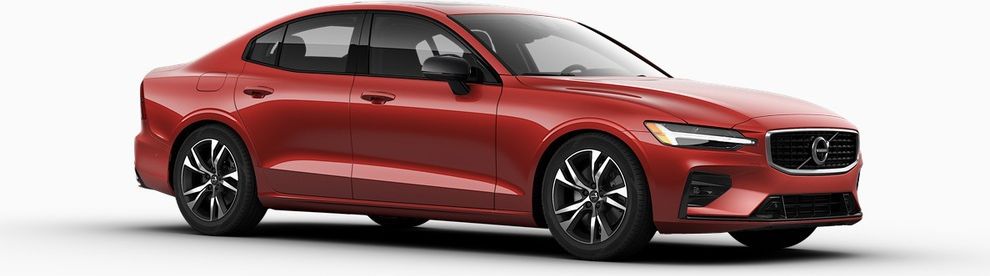
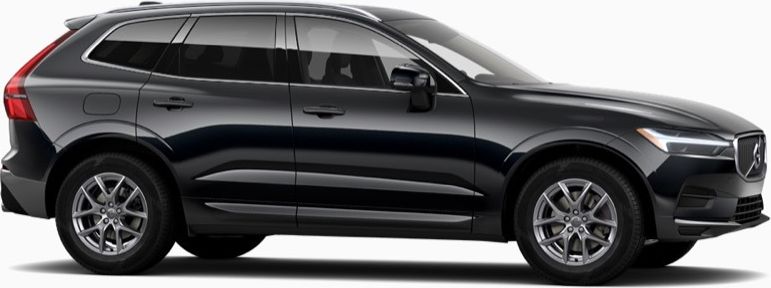
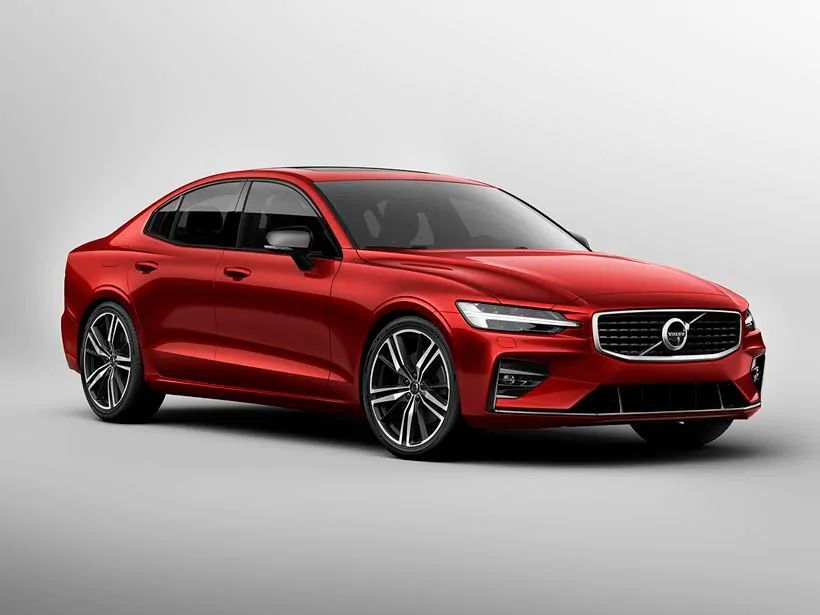
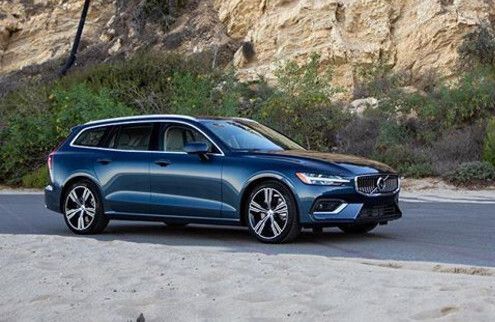
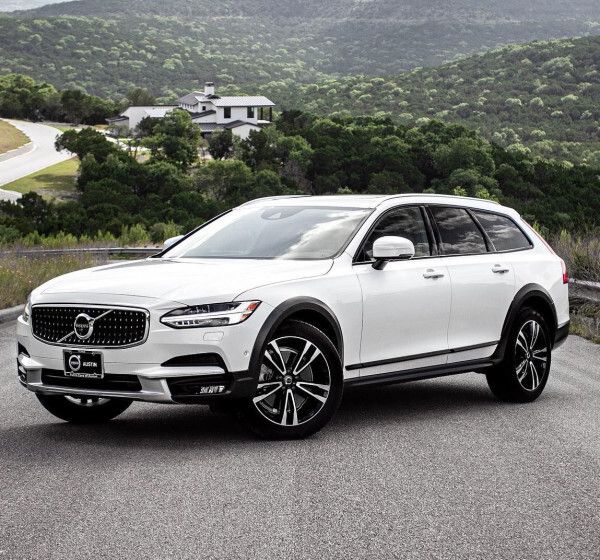
Current Lineup


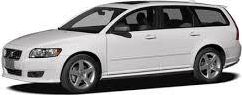
Discontinued Models

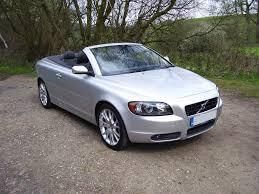
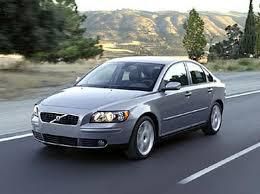
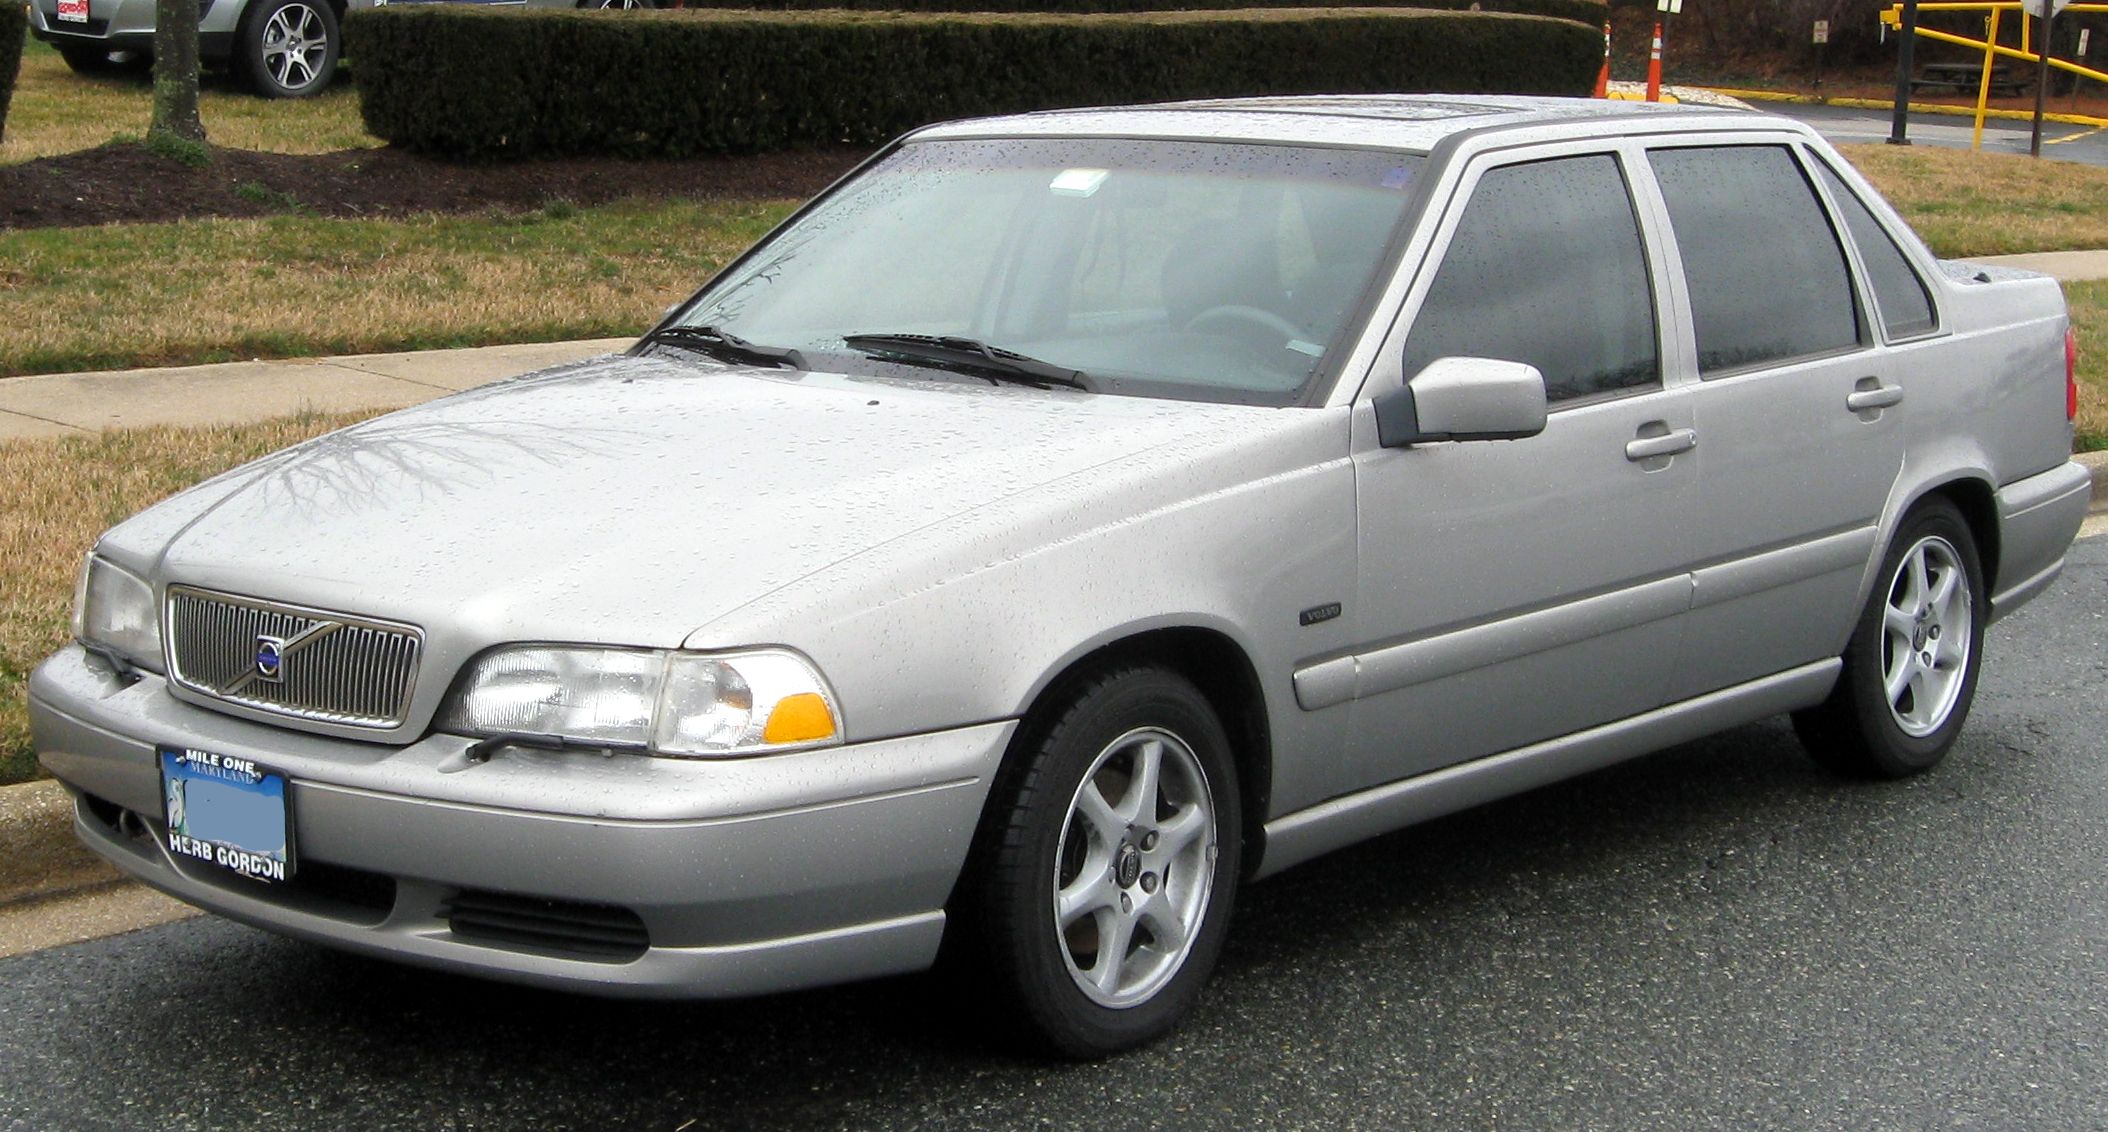
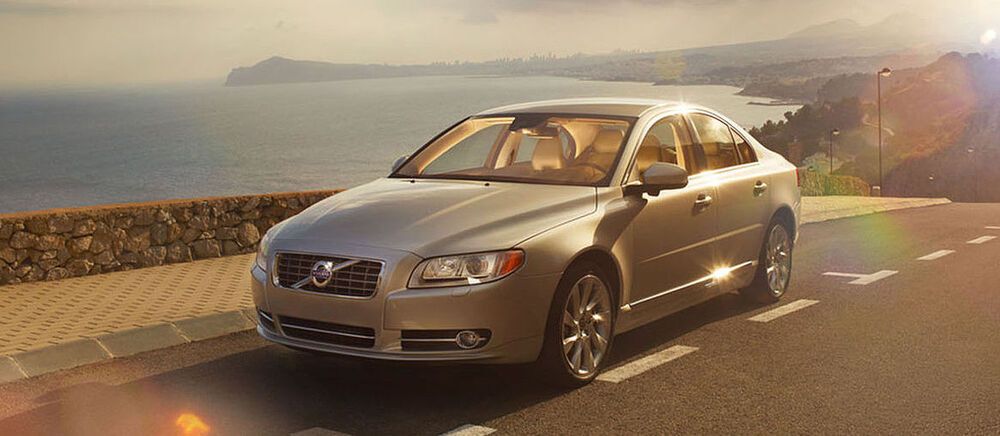
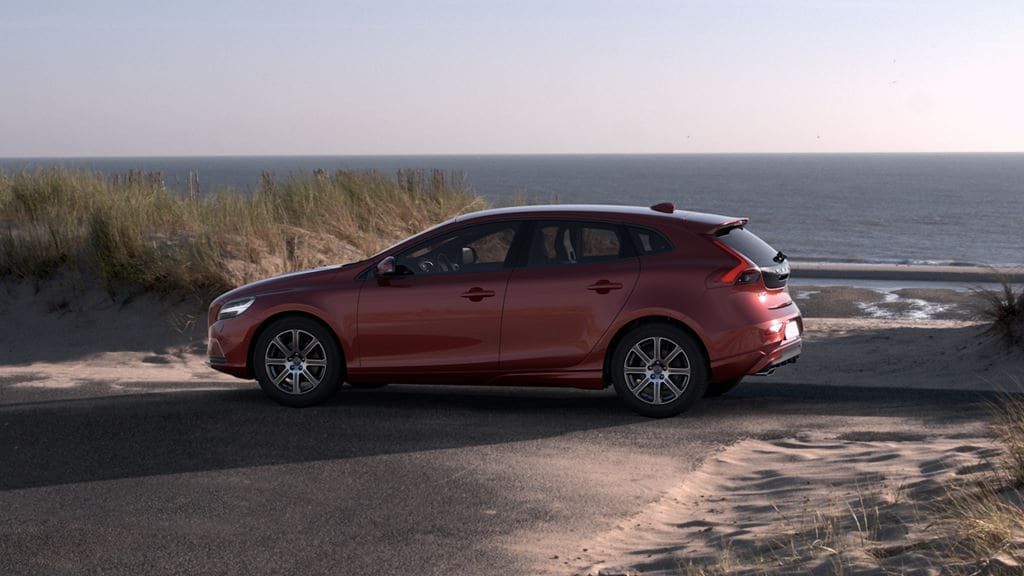

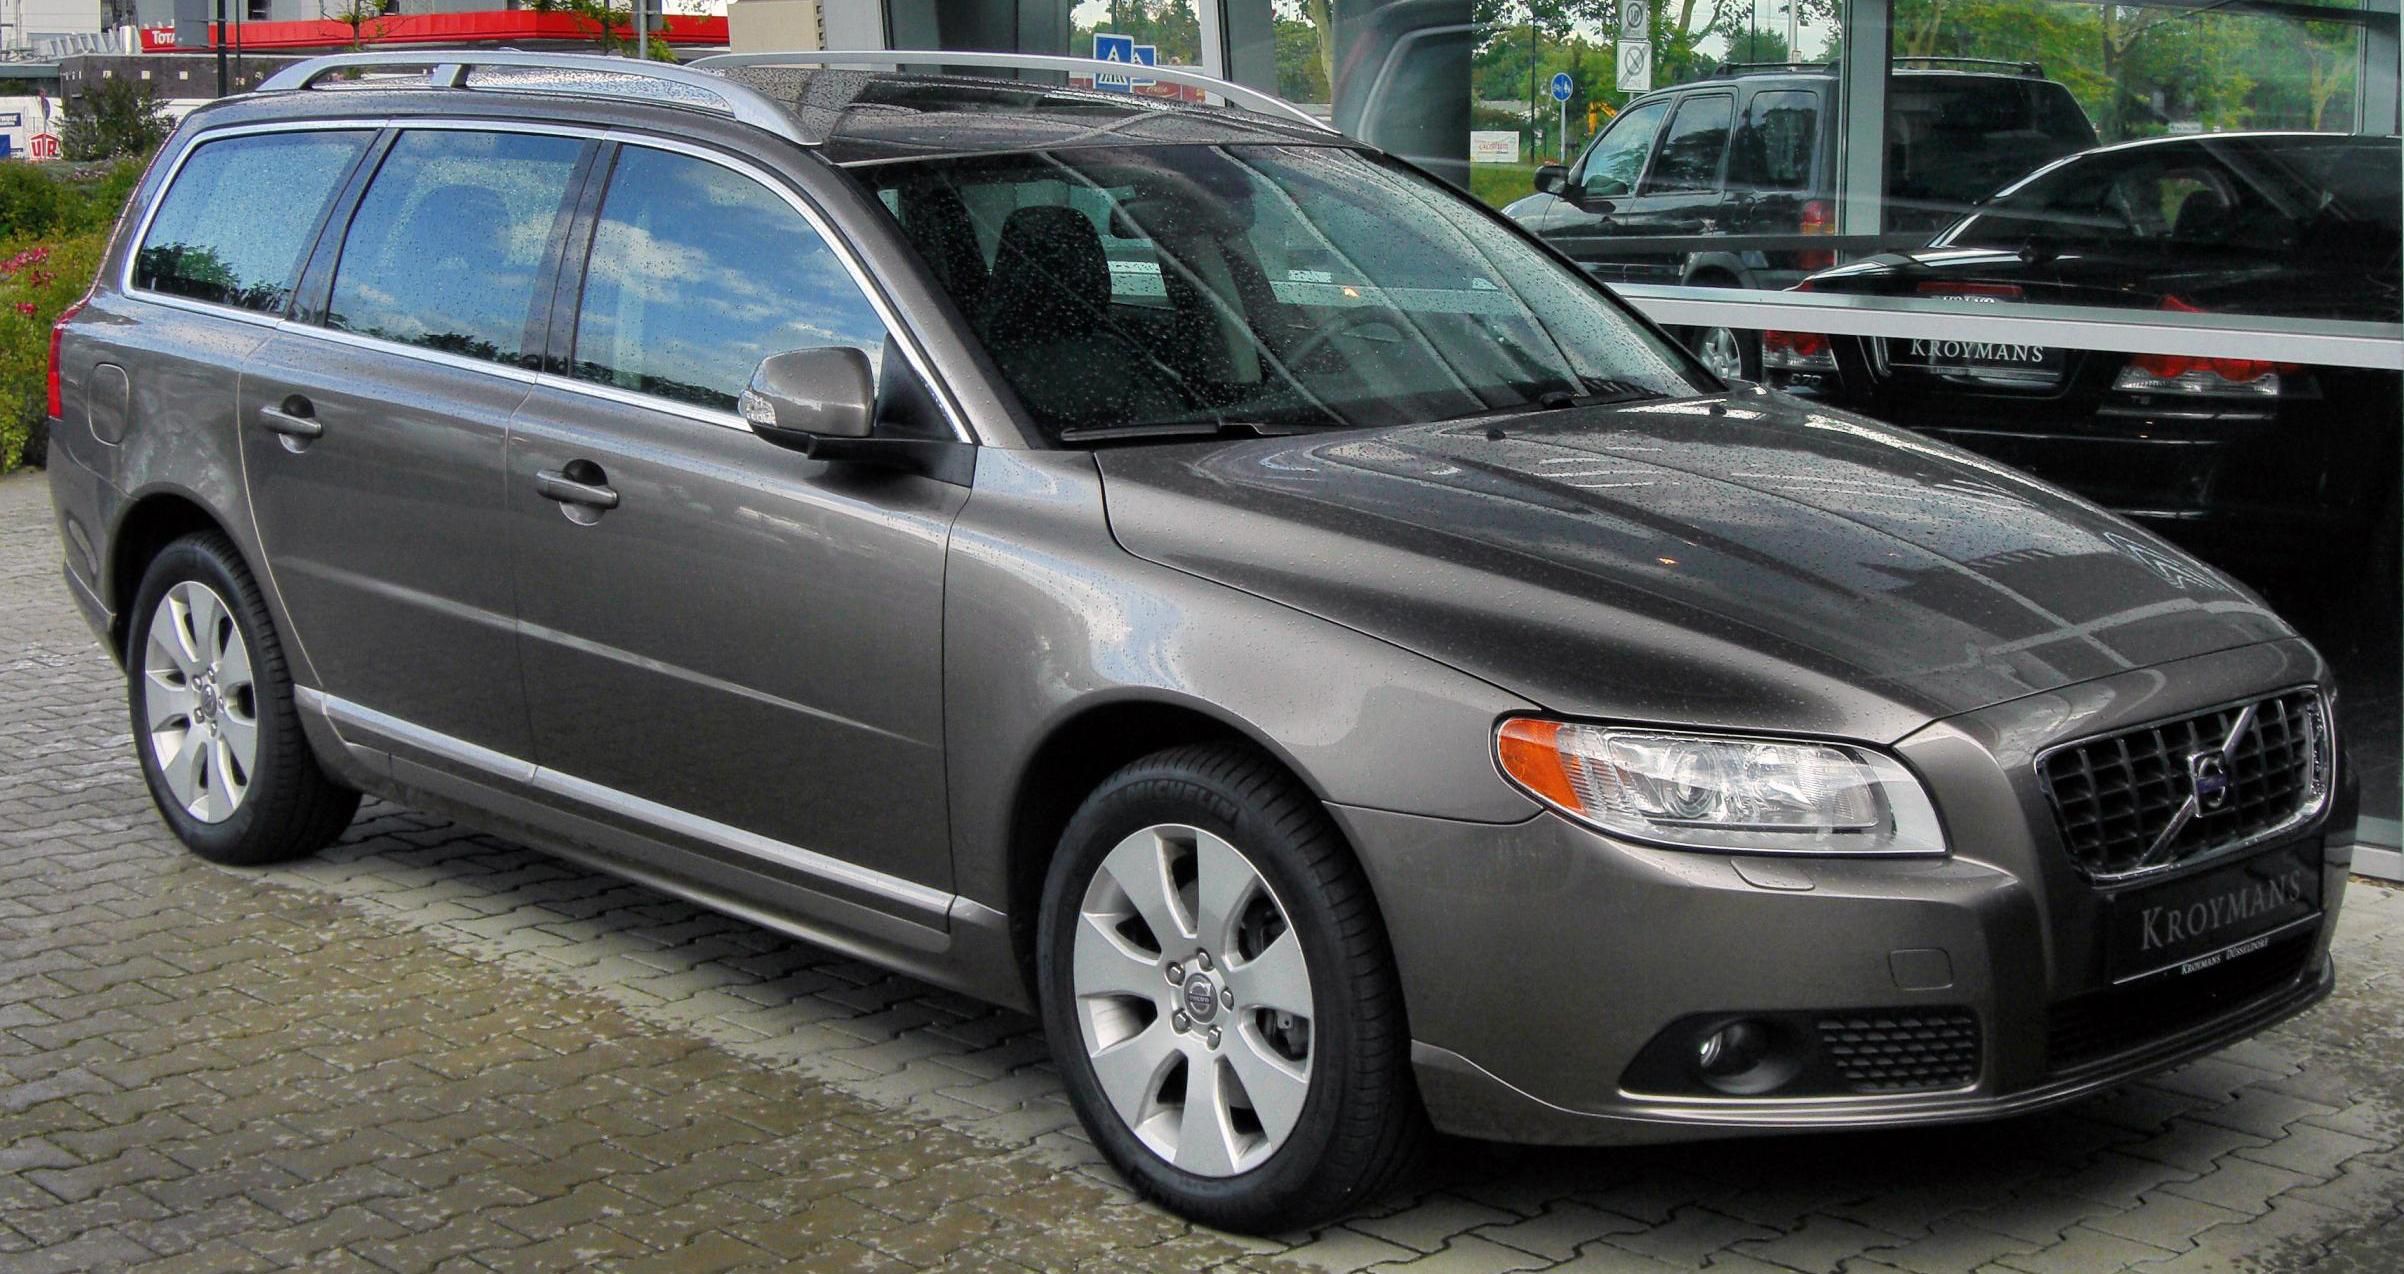
Volvo includes the cars 2013 C30, 2022 C40, 2013 C70, 2011 S40, 2024 S60, 2000 S70, 2016 S80, 2024 S90, 2004 V40, 2011 V50, 2024 V60, 2010 V70, 2024 V90, 2024 XC40, 2024 XC60, 2016 XC70, 2024 XC90
Loading, please wait
Year | Q1 | Q2 | Q3 | Q4 |
|---|---|---|---|---|
| 2005 | 56,222 | 33,845 | 31,879 | 25,928 |
| 2006 | 28,451 | 30,790 | 30,635 | 26,195 |
| 2007 | 26,953 | 26,933 | 27,104 | 25,372 |
| 2008 | 24,804 | 21,377 | 13,847 | 13,074 |
| 2009 | 12,624 | 17,122 | 16,983 | 14,706 |
| 2010 | 14,006 | 14,200 | 12,912 | 12,821 |
| 2011 | 15,440 | 20,863 | 15,852 | 15,385 |
| 2012 | 16,417 | 18,202 | 17,017 | 16,491 |
| 2013 | 15,107 | 17,470 | 15,615 | 13,040 |
| 2014 | 13,703 | 15,632 | 14,521 | 12,515 |
| 2015 | 13,722 | 15,644 | 17,015 | 23,665 |
| 2016 | 16,359 | 20,293 | 21,880 | 24,186 |
| 2017 | 13,476 | 20,626 | 22,861 | 24,541 |
| 2018 | 20,083 | 27,539 | 26,307 | 24,327 |
| 2019 | 20,710 | 28,062 | 27,312 | 30,802 |
| 2020 | 19,485 | 21,061 | 27,672 | 35,763 |
| 2021 | 27,239 | 36,515 | 31,611 | 26,808 |
| 2022 | 22,696 | 27,828 | 6,627 | 11,111 |
| 2023 | 17,923 | 0 | 0 | 0 |
| 2024 | 9,586 | - | - | - |
Loading, please wait
Year | Sales |
|---|---|
| 2024 | 18,069 |
| 2023 | 17,923 |
| 2022 | 68,262 |
| 2021 | 122,173 |
| 2020 | 103,981 |
| 2019 | 106,886 |
| 2018 | 98,256 |
| 2017 | 81,504 |
| 2016 | 82,718 |
| 2015 | 70,046 |
| 2014 | 56,371 |
| 2013 | 61,232 |
| 2012 | 68,127 |
| 2011 | 67,540 |
| 2010 | 53,939 |
| 2009 | 61,435 |
| 2008 | 73,102 |
| 2007 | 106,362 |
| 2006 | 116,071 |
| 2005 | 147,874 |
| Total | 1,581,871 |