Key Stats
How many S60 did Volvo sell in 2025?
Volvo sold 1,523 S60 in 2025. (From Jan - Mar 2025)
How many S60 did Volvo sell in March 2025?
Volvo sold 466 S60 in March 2025.
How many S60 did Volvo sell in 2024?
Volvo sold 1,750 S60 in 2024. In 2023, Volvo sold 1,406 S60. They sold 344 more units in 2024 compared to 2023 with a percent gain of 24.47% YoY.
Overview
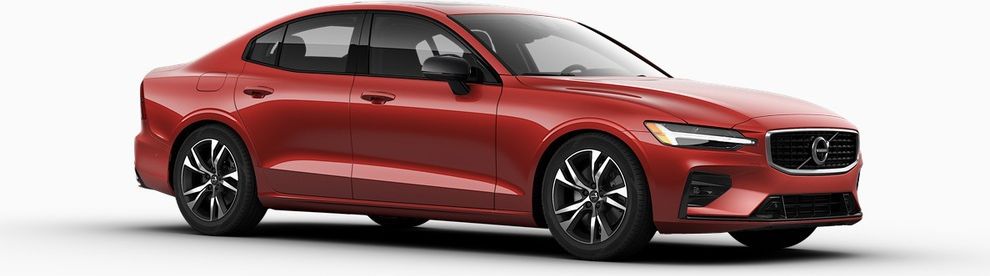
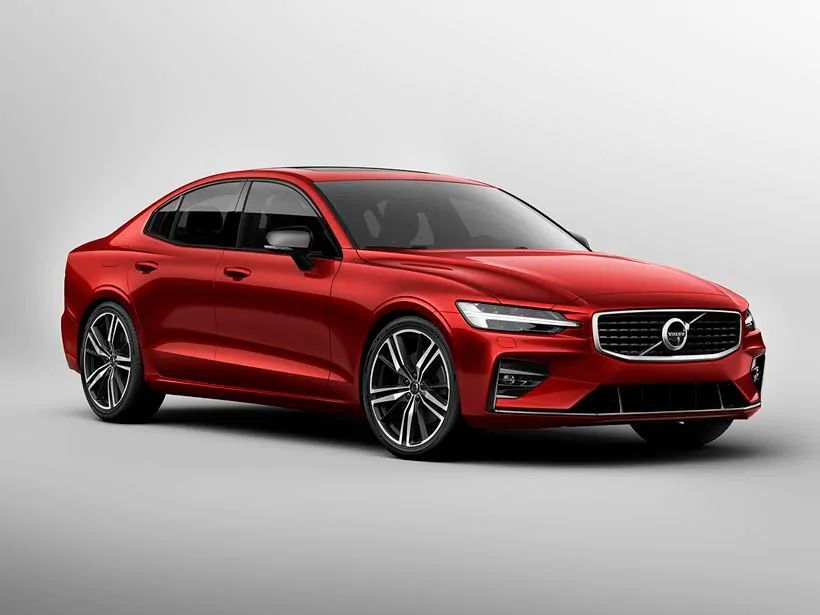
The 2024 Volvo S60 is a vehicle from automaker Volvo.
How Much Does the 2024 Volvo S60 Cost?
The 2024 Volvo S60 starts at $42,000 MSRP. Fully loaded, the Volvo S60 will cost you about $49,750.
Volvo S60 Engine, Transmission, and Performance Numbers
Volvo S60 is powered by a 2.0-liter engine with a Front Wheel Drive powertrain that makes 247 -hp and 258 lb-ft torque. The transmission on the Volvo S60 is an 8-Speed Geartronic Automatic.
List of Volvo S60 Competitors
Some of Volvo S60 competitors include the Genesis G70 and BMW 3-Series.
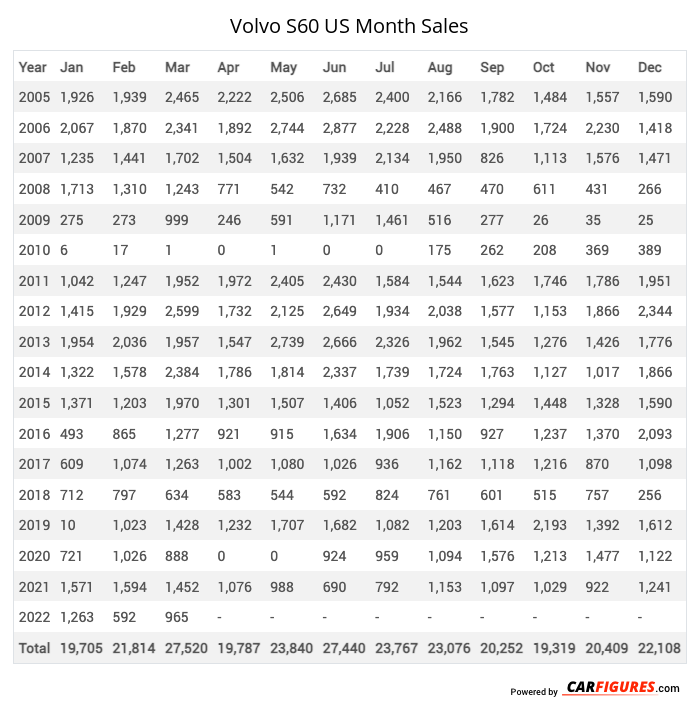
Volvo S60 United States Sale figures by year, quarter, and month are presented below. Including the most up to date sales data for the Volvo S60.
*Sales report includes S60, S60 Cross Country
Year | Jan | Feb | Mar | Apr | May | Jun | Jul | Aug | Sep | Oct | Nov | Dec |
|---|---|---|---|---|---|---|---|---|---|---|---|---|
| 2005 | 1,926 | 1,939 | 2,465 | 2,222 | 2,506 | 2,685 | 2,400 | 2,166 | 1,782 | 1,484 | 1,557 | 1,590 |
| 2006 | 2,067 | 1,870 | 2,341 | 1,892 | 2,744 | 2,877 | 2,228 | 2,488 | 1,900 | 1,724 | 2,230 | 1,418 |
| 2007 | 1,235 | 1,441 | 1,702 | 1,504 | 1,632 | 1,939 | 2,134 | 1,950 | 826 | 1,113 | 1,576 | 1,471 |
| 2008 | 1,713 | 1,310 | 1,243 | 771 | 542 | 732 | 410 | 467 | 470 | 611 | 431 | 266 |
| 2009 | 275 | 273 | 999 | 246 | 591 | 1,171 | 1,461 | 516 | 277 | 26 | 35 | 25 |
| 2010 | 6 | 17 | 1 | 0 | 1 | 0 | 0 | 175 | 262 | 208 | 369 | 389 |
| 2011 | 1,042 | 1,247 | 1,952 | 1,972 | 2,405 | 2,430 | 1,584 | 1,544 | 1,623 | 1,746 | 1,786 | 1,951 |
| 2012 | 1,415 | 1,929 | 2,599 | 1,732 | 2,125 | 2,649 | 1,934 | 2,038 | 1,577 | 1,153 | 1,866 | 2,344 |
| 2013 | 1,954 | 2,036 | 1,957 | 1,547 | 2,739 | 2,666 | 2,326 | 1,962 | 1,545 | 1,276 | 1,426 | 1,776 |
| 2014 | 1,322 | 1,578 | 2,384 | 1,786 | 1,814 | 2,337 | 1,739 | 1,724 | 1,763 | 1,127 | 1,017 | 1,866 |
| 2015 | 1,371 | 1,203 | 1,970 | 1,301 | 1,507 | 1,406 | 1,052 | 1,523 | 1,294 | 1,448 | 1,328 | 1,590 |
| 2016 | 493 | 865 | 1,277 | 921 | 915 | 1,634 | 1,906 | 1,150 | 927 | 1,237 | 1,370 | 2,093 |
| 2017 | 609 | 1,074 | 1,263 | 1,002 | 1,080 | 1,026 | 936 | 1,162 | 1,118 | 1,216 | 870 | 1,098 |
| 2018 | 712 | 797 | 634 | 583 | 544 | 592 | 824 | 761 | 601 | 515 | 757 | 256 |
| 2019 | 10 | 1,023 | 1,428 | 1,232 | 1,707 | 1,682 | 1,082 | 1,203 | 1,614 | 2,193 | 1,392 | 1,612 |
| 2020 | 721 | 1,026 | 888 | 0 | 0 | 924 | 959 | 1,094 | 1,576 | 1,213 | 1,477 | 1,122 |
| 2021 | 1,571 | 1,594 | 1,452 | 1,076 | 988 | 690 | 792 | 1,153 | 1,097 | 1,029 | 922 | 1,241 |
| 2022 | 1,263 | 592 | 965 | 471 | 280 | 433 | 0 | 0 | 451 | 0 | 0 | 822 |
| 2023 | 523 | 0 | 883 | 0 | 0 | 0 | 0 | 0 | 0 | 0 | 0 | 0 |
| 2024 | 918 | 0 | 0 | 0 | 0 | 0 | 0 | 0 | 832 | 0 | 0 | 0 |
| 2025 | - | 1,057 | 466 | - | - | - | - | - | - | - | - | - |
| Total | 21,146 | 22,871 | 28,869 | 20,258 | 24,120 | 27,873 | 23,767 | 23,076 | 21,535 | 19,319 | 20,409 | 22,930 |
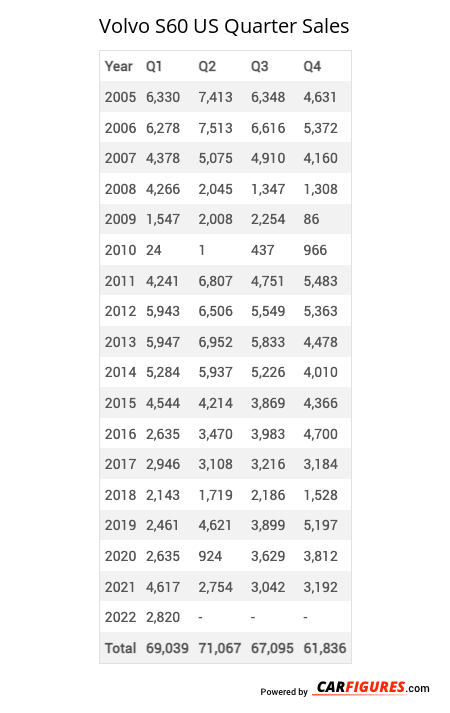
Year | Q1 | Q2 | Q3 | Q4 |
|---|---|---|---|---|
| 2005 | 6,330 | 7,413 | 6,348 | 4,631 |
| 2006 | 6,278 | 7,513 | 6,616 | 5,372 |
| 2007 | 4,378 | 5,075 | 4,910 | 4,160 |
| 2008 | 4,266 | 2,045 | 1,347 | 1,308 |
| 2009 | 1,547 | 2,008 | 2,254 | 86 |
| 2010 | 24 | 1 | 437 | 966 |
| 2011 | 4,241 | 6,807 | 4,751 | 5,483 |
| 2012 | 5,943 | 6,506 | 5,549 | 5,363 |
| 2013 | 5,947 | 6,952 | 5,833 | 4,478 |
| 2014 | 5,284 | 5,937 | 5,226 | 4,010 |
| 2015 | 4,544 | 4,214 | 3,869 | 4,366 |
| 2016 | 2,635 | 3,470 | 3,983 | 4,700 |
| 2017 | 2,946 | 3,108 | 3,216 | 3,184 |
| 2018 | 2,143 | 1,719 | 2,186 | 1,528 |
| 2019 | 2,461 | 4,621 | 3,899 | 5,197 |
| 2020 | 2,635 | 924 | 3,629 | 3,812 |
| 2021 | 4,617 | 2,754 | 3,042 | 3,192 |
| 2022 | 2,820 | 1,184 | 451 | 822 |
| 2023 | 1,406 | 0 | 0 | 0 |
| 2024 | 918 | 0 | 832 | 0 |
| 2025 | 1,523 | - | - | - |
| Total | 72,886 | 72,251 | 68,378 | 62,658 |
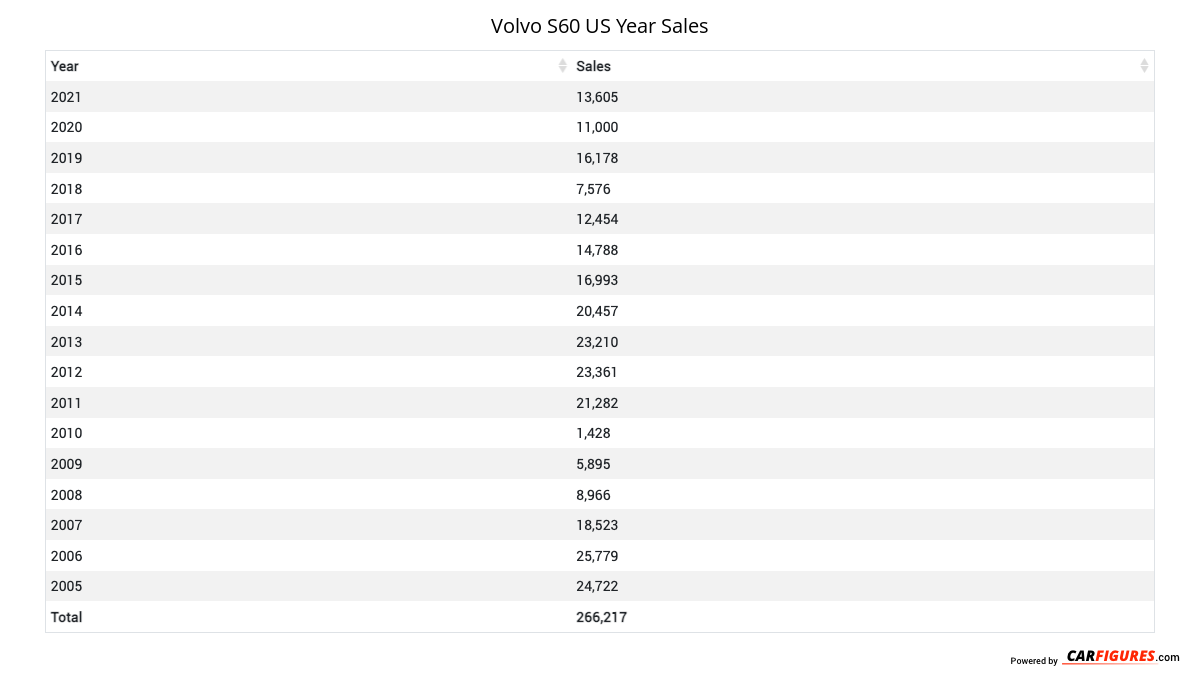
Year | Sales |
|---|---|
| 2024 | 1,750 |
| 2023 | 1,406 |
| 2022 | 5,277 |
| 2021 | 13,605 |
| 2020 | 11,000 |
| 2019 | 16,178 |
| 2018 | 7,576 |
| 2017 | 12,454 |
| 2016 | 14,788 |
| 2015 | 16,993 |
| 2014 | 20,457 |
| 2013 | 23,210 |
| 2012 | 23,361 |
| 2011 | 21,282 |
| 2010 | 1,428 |
| 2009 | 5,895 |
| 2008 | 8,966 |
| 2007 | 18,523 |
| 2006 | 25,779 |
| 2005 | 24,722 |
| Total | 274,650 |
Download Historic Sales Data
Embedded Code
See more widgetsSources: Manufacturers