Key Stats
How many Mirai did Toyota sell in 2025?
Toyota sold 33 Mirai in 2025. (From Jan - Mar 2025)
How many Mirai did Toyota sell in February 2025?
Toyota sold 16 Mirai in February 2025.
How many Mirai did Toyota sell in 2024?
Toyota sold 499 Mirai in 2024. In 2023, Toyota sold 2,737 Mirai. They sold 2,238 more units in year 2023 compared to 2024 with a percent loss of 81.77% YoY.
Overview
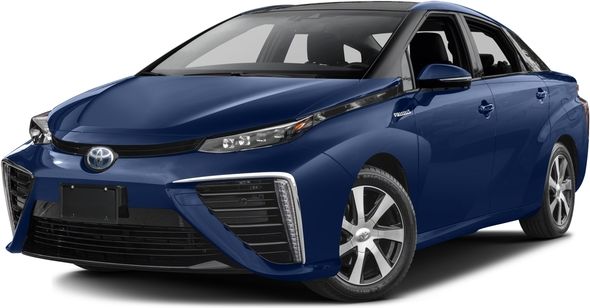
The 2022 Toyota Mirai is a vehicle from automaker Toyota.
How Much Does the 2022 Toyota Mirai Cost?
Pricing for the 2022 Toyota Mirai starts at $49,500 MSRP and goes up to $66,000 fully loaded.
Toyota Mirai Engine, Transmission, and Performance Numbers
Toyota Mirai includes an engine combined with a 1-Speed Automatic. This delivers hp with 221 lb-ft torque delivered through a Rear Wheel Drive drivetrain.
List of Toyota Mirai Competitors
Some of Toyota Mirai competitors include the Honda Clarity, Hyundai Nexo and Tesla Model Y.
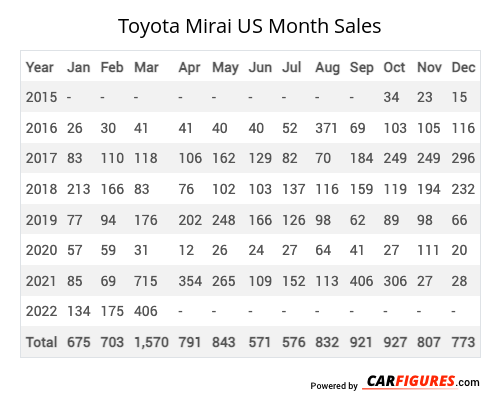
Toyota Mirai United States Sale figures by year, quarter, and month are presented below. Including the most up to date sales data for the Toyota Mirai.
Year | Jan | Feb | Mar | Apr | May | Jun | Jul | Aug | Sep | Oct | Nov | Dec |
|---|---|---|---|---|---|---|---|---|---|---|---|---|
| 2015 | - | - | - | - | - | - | - | - | - | 34 | 23 | 15 |
| 2016 | 26 | 30 | 41 | 41 | 40 | 40 | 52 | 371 | 69 | 103 | 105 | 116 |
| 2017 | 83 | 110 | 118 | 106 | 162 | 129 | 82 | 70 | 184 | 249 | 249 | 296 |
| 2018 | 213 | 166 | 83 | 76 | 102 | 103 | 137 | 116 | 159 | 119 | 194 | 232 |
| 2019 | 77 | 94 | 176 | 202 | 248 | 166 | 126 | 98 | 62 | 89 | 98 | 66 |
| 2020 | 57 | 59 | 31 | 12 | 26 | 24 | 27 | 64 | 41 | 27 | 111 | 20 |
| 2021 | 85 | 69 | 715 | 354 | 265 | 109 | 152 | 113 | 406 | 306 | 27 | 28 |
| 2022 | 134 | 175 | 406 | 123 | 267 | 253 | 62 | 10 | 7 | 152 | 202 | 303 |
| 2023 | 222 | 238 | 208 | 203 | 406 | 445 | 463 | 287 | 132 | 57 | 53 | 23 |
| 2024 | 44 | 57 | 71 | 35 | 18 | 20 | 26 | 45 | 30 | 29 | 89 | 35 |
| 2025 | 17 | 16 | - | - | - | - | - | - | - | - | - | - |
| Total | 958 | 1,014 | 1,849 | 1,152 | 1,534 | 1,289 | 1,127 | 1,174 | 1,090 | 1,165 | 1,151 | 1,134 |
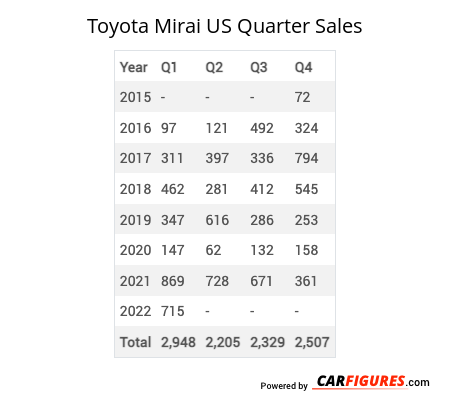
Year | Q1 | Q2 | Q3 | Q4 |
|---|---|---|---|---|
| 2015 | - | - | - | 72 |
| 2016 | 97 | 121 | 492 | 324 |
| 2017 | 311 | 397 | 336 | 794 |
| 2018 | 462 | 281 | 412 | 545 |
| 2019 | 347 | 616 | 286 | 253 |
| 2020 | 147 | 62 | 132 | 158 |
| 2021 | 869 | 728 | 671 | 361 |
| 2022 | 715 | 643 | 79 | 657 |
| 2023 | 668 | 1,054 | 882 | 133 |
| 2024 | 172 | 73 | 101 | 153 |
| 2025 | 33 | - | - | - |
| Total | 3,821 | 3,975 | 3,391 | 3,450 |
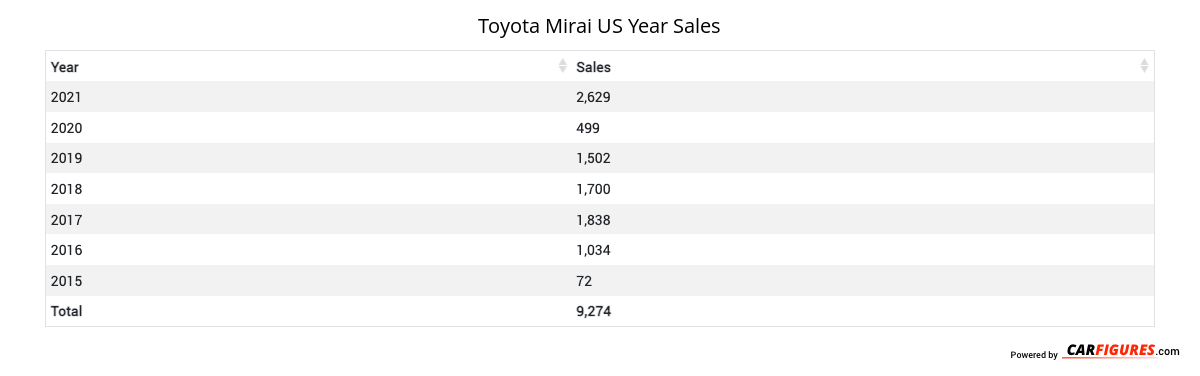
Year | Sales |
|---|---|
| 2024 | 499 |
| 2023 | 2,737 |
| 2022 | 2,094 |
| 2021 | 2,629 |
| 2020 | 499 |
| 2019 | 1,502 |
| 2018 | 1,700 |
| 2017 | 1,838 |
| 2016 | 1,034 |
| 2015 | 72 |
| Total | 14,604 |
Download Historic Sales Data
Embedded Code
See more widgetsSources: Manufacturers