
Key Stats
How many Highlander did Toyota sell in 2025?
Toyota sold 12,017 Highlander in 2025. (From Jan - Mar 2025)
How many Highlander did Toyota sell in March 2025?
Toyota sold 5,523 Highlander in March 2025.
How many Highlander did Toyota sell in 2024?
Toyota sold 89,658 Highlander in 2024. In 2023, Toyota sold 171,289 Highlander. They sold 81,631 more units in year 2023 compared to 2024 with a percent loss of 47.66% YoY.
Overview
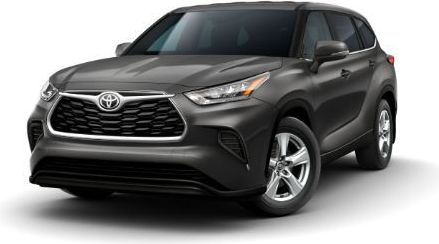
The 2022 Toyota Highlander is a vehicle from automaker Toyota.
How Much Does the 2022 Toyota Highlander Cost?
The 2022 Toyota Highlander starts at $35,405 MSRP. Fully loaded, the Toyota Highlander will cost you about $49,710.
Toyota Highlander Engine, Transmission, and Performance Numbers
Toyota Highlander includes a 3.5-liter engine combined with a Direct-Shift 8-Speed Automatic. This delivers 295 hp with 263 lb-ft torque delivered through a Front Wheel Drive drivetrain.
List of Toyota Highlander Competitors
Some of Toyota Highlander competitors include the Kia Telluride, Hyundai Palisade and Honda Pilot.
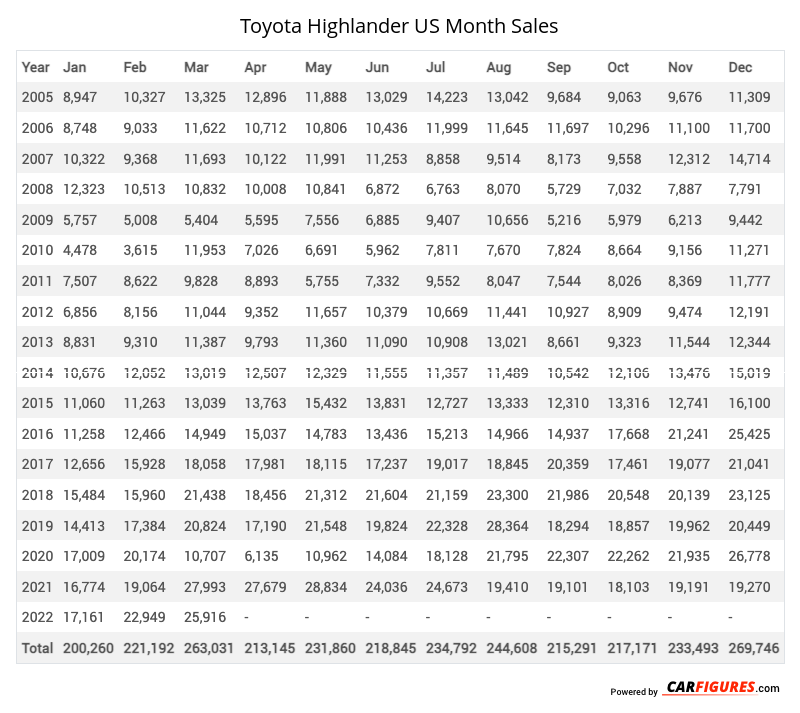
Toyota Highlander United States Sale figures by year, quarter, and month are presented below. Including the most up to date sales data for the Toyota Highlander. See how the Toyota Highlander stacks up the other models in the Crossover/SUVS, Midsize Crossover/SUVs segments.
Year | Jan | Feb | Mar | Apr | May | Jun | Jul | Aug | Sep | Oct | Nov | Dec |
|---|---|---|---|---|---|---|---|---|---|---|---|---|
| 2005 | 8,947 | 10,327 | 13,325 | 12,896 | 11,888 | 13,029 | 14,223 | 13,042 | 9,684 | 9,063 | 9,676 | 11,309 |
| 2006 | 8,748 | 9,033 | 11,622 | 10,712 | 10,806 | 10,436 | 11,999 | 11,645 | 11,697 | 10,296 | 11,100 | 11,700 |
| 2007 | 10,322 | 9,368 | 11,693 | 10,122 | 11,991 | 11,253 | 8,858 | 9,514 | 8,173 | 9,558 | 12,312 | 14,714 |
| 2008 | 12,323 | 10,513 | 10,832 | 10,008 | 10,841 | 6,872 | 6,763 | 8,070 | 5,729 | 7,032 | 7,887 | 7,791 |
| 2009 | 5,757 | 5,008 | 5,404 | 5,595 | 7,556 | 6,885 | 9,407 | 10,656 | 5,216 | 5,979 | 6,213 | 9,442 |
| 2010 | 4,478 | 3,615 | 11,953 | 7,026 | 6,691 | 5,962 | 7,811 | 7,670 | 7,824 | 8,664 | 9,156 | 11,271 |
| 2011 | 7,507 | 8,622 | 9,828 | 8,893 | 5,755 | 7,332 | 9,552 | 8,047 | 7,544 | 8,026 | 8,369 | 11,777 |
| 2012 | 6,856 | 8,156 | 11,044 | 9,352 | 11,657 | 10,379 | 10,669 | 11,441 | 10,927 | 8,909 | 9,474 | 12,191 |
| 2013 | 8,831 | 9,310 | 11,387 | 9,793 | 11,360 | 11,090 | 10,908 | 13,021 | 8,661 | 9,323 | 11,544 | 12,344 |
| 2014 | 10,676 | 12,052 | 13,019 | 12,507 | 12,329 | 11,555 | 11,357 | 11,489 | 10,542 | 12,106 | 13,476 | 15,019 |
| 2015 | 11,060 | 11,263 | 13,039 | 13,763 | 15,432 | 13,831 | 12,727 | 13,333 | 12,310 | 13,316 | 12,741 | 16,100 |
| 2016 | 11,258 | 12,466 | 14,949 | 15,037 | 14,783 | 13,436 | 15,213 | 14,966 | 14,937 | 17,668 | 21,241 | 25,425 |
| 2017 | 12,656 | 15,928 | 18,058 | 17,981 | 18,115 | 17,237 | 19,017 | 18,845 | 20,359 | 17,461 | 19,077 | 21,041 |
| 2018 | 15,484 | 15,960 | 21,438 | 18,456 | 21,312 | 21,604 | 21,159 | 23,300 | 21,986 | 20,548 | 20,139 | 23,125 |
| 2019 | 14,413 | 17,384 | 20,824 | 17,190 | 21,548 | 19,824 | 22,328 | 28,364 | 18,294 | 18,857 | 19,962 | 20,449 |
| 2020 | 17,009 | 20,174 | 10,707 | 6,135 | 10,962 | 14,084 | 18,128 | 21,795 | 22,307 | 22,262 | 21,935 | 26,778 |
| 2021 | 16,774 | 19,064 | 27,993 | 27,679 | 28,834 | 24,036 | 24,673 | 19,410 | 19,101 | 18,103 | 19,191 | 19,270 |
| 2022 | 17,161 | 22,949 | 25,916 | 19,788 | 15,619 | 15,970 | 12,529 | 14,776 | 19,743 | 17,962 | 20,145 | 20,247 |
| 2023 | 14,264 | 18,821 | 22,259 | 19,353 | 20,025 | 18,542 | 8,590 | 8,663 | 9,407 | 9,536 | 9,499 | 12,330 |
| 2024 | 10,004 | 10,491 | 11,538 | 10,256 | 8,909 | 8,910 | 6,058 | 6,061 | 5,060 | 5,258 | 3,861 | 3,252 |
| 2025 | 2,672 | 3,822 | 5,523 | - | - | - | - | - | - | - | - | - |
| Total | 227,200 | 254,326 | 302,351 | 262,542 | 276,413 | 262,267 | 261,969 | 274,108 | 249,501 | 249,927 | 266,998 | 305,575 |
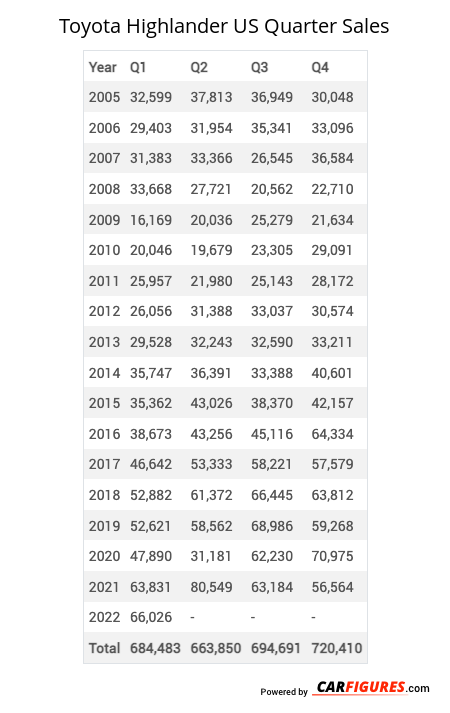
Year | Q1 | Q2 | Q3 | Q4 |
|---|---|---|---|---|
| 2005 | 32,599 | 37,813 | 36,949 | 30,048 |
| 2006 | 29,403 | 31,954 | 35,341 | 33,096 |
| 2007 | 31,383 | 33,366 | 26,545 | 36,584 |
| 2008 | 33,668 | 27,721 | 20,562 | 22,710 |
| 2009 | 16,169 | 20,036 | 25,279 | 21,634 |
| 2010 | 20,046 | 19,679 | 23,305 | 29,091 |
| 2011 | 25,957 | 21,980 | 25,143 | 28,172 |
| 2012 | 26,056 | 31,388 | 33,037 | 30,574 |
| 2013 | 29,528 | 32,243 | 32,590 | 33,211 |
| 2014 | 35,747 | 36,391 | 33,388 | 40,601 |
| 2015 | 35,362 | 43,026 | 38,370 | 42,157 |
| 2016 | 38,673 | 43,256 | 45,116 | 64,334 |
| 2017 | 46,642 | 53,333 | 58,221 | 57,579 |
| 2018 | 52,882 | 61,372 | 66,445 | 63,812 |
| 2019 | 52,621 | 58,562 | 68,986 | 59,268 |
| 2020 | 47,890 | 31,181 | 62,230 | 70,975 |
| 2021 | 63,831 | 80,549 | 63,184 | 56,564 |
| 2022 | 66,026 | 51,377 | 47,048 | 58,354 |
| 2023 | 55,344 | 57,920 | 26,660 | 31,365 |
| 2024 | 32,033 | 28,075 | 17,179 | 12,371 |
| 2025 | 12,017 | - | - | - |
| Total | 783,877 | 801,222 | 785,578 | 822,500 |
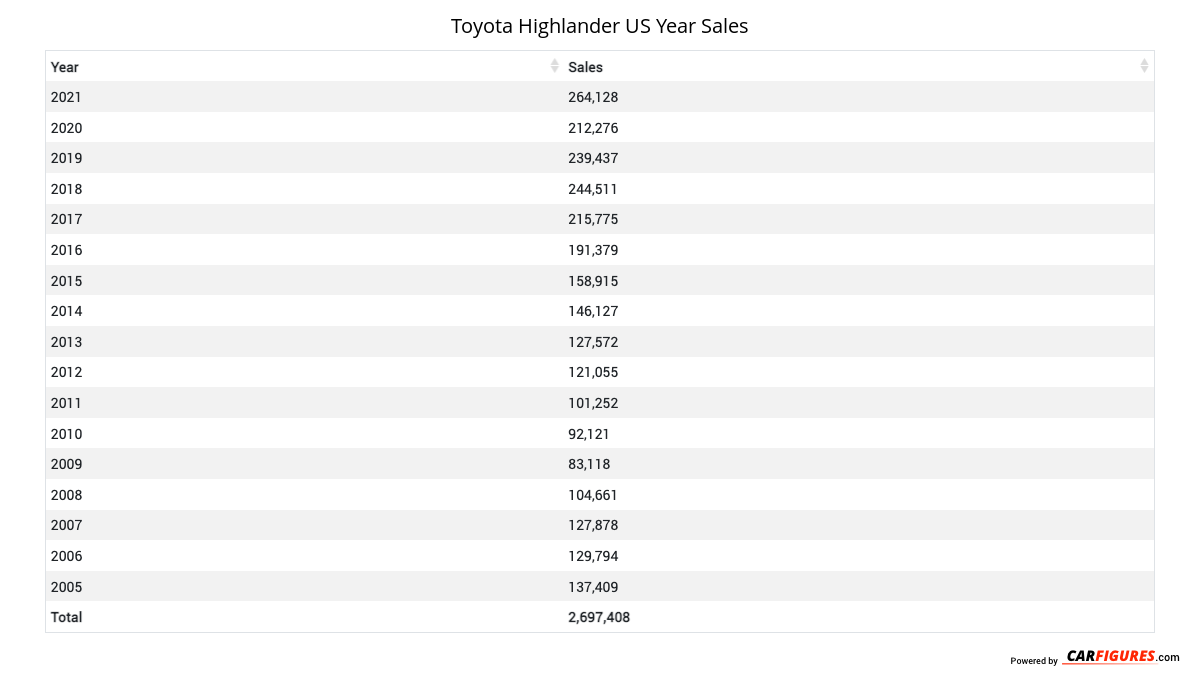
Year | Sales |
|---|---|
| 2024 | 89,658 |
| 2023 | 171,289 |
| 2022 | 222,805 |
| 2021 | 264,128 |
| 2020 | 212,276 |
| 2019 | 239,437 |
| 2018 | 244,511 |
| 2017 | 215,775 |
| 2016 | 191,379 |
| 2015 | 158,915 |
| 2014 | 146,127 |
| 2013 | 127,572 |
| 2012 | 121,055 |
| 2011 | 101,252 |
| 2010 | 92,121 |
| 2009 | 83,118 |
| 2008 | 104,661 |
| 2007 | 127,878 |
| 2006 | 129,794 |
| 2005 | 137,409 |
| Total | 3,181,160 |
Download Historic Sales Data
Embedded Code
See more widgetsSources: Manufacturers