
Overview
The Toyota 86 is a Coupe with room for 4 people from automaker Toyota.
How Much Does the 2020 Toyota 86 Cost?
Pricing for the 2020 Toyota 86 starts at $27,060 MSRP and goes up to $30,190 fully loaded.
Toyota 86 Engine, Transmission, and Performance Numbers
Toyota 86 is powered by a 2.0-liter H-4 engine with a RWD powertrain that makes 205 -hp and torque. The transmission on the Toyota 86 is an.
2020 Toyota 86 Fuel Economy
The 2020 Toyota 86 has a rating of 24 mpg combined.
List of Toyota 86 Competitors
Some of Toyota 86 competitors include the Mazda MX-5 Miata and Honda Civic.
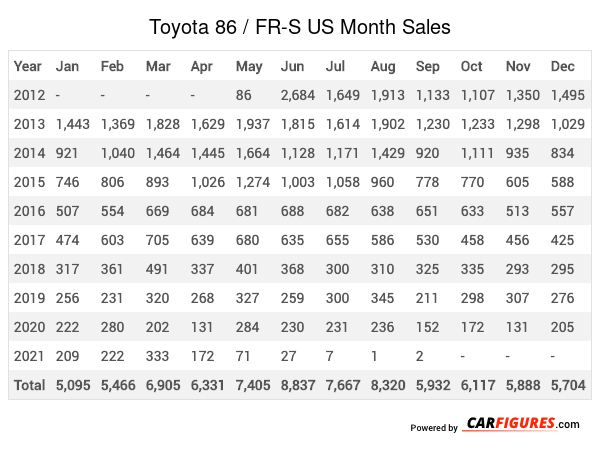
Toyota 86 / FR-S United States Sale figures by year, quarter, and month are presented below. Including the most up to date sales data for the Toyota 86 / FR-S. See how the Toyota 86 / FR-S stacks up the other models in the Cars, Sport/Performance Cars segments.
Loading, please wait
Year | Jan | Feb | Mar | Apr | May | Jun | Jul | Aug | Sep | Oct | Nov | Dec |
|---|---|---|---|---|---|---|---|---|---|---|---|---|
| 2012 | - | - | - | - | 86 | 2,684 | 1,649 | 1,913 | 1,133 | 1,107 | 1,350 | 1,495 |
| 2013 | 1,443 | 1,369 | 1,828 | 1,629 | 1,937 | 1,815 | 1,614 | 1,902 | 1,230 | 1,233 | 1,298 | 1,029 |
| 2014 | 921 | 1,040 | 1,464 | 1,445 | 1,664 | 1,128 | 1,171 | 1,429 | 920 | 1,111 | 935 | 834 |
| 2015 | 746 | 806 | 893 | 1,026 | 1,274 | 1,003 | 1,058 | 960 | 778 | 770 | 605 | 588 |
| 2016 | 507 | 554 | 669 | 684 | 681 | 688 | 682 | 638 | 651 | 633 | 513 | 557 |
| 2017 | 474 | 603 | 705 | 639 | 680 | 635 | 655 | 586 | 530 | 458 | 456 | 425 |
| 2018 | 317 | 361 | 491 | 337 | 401 | 368 | 300 | 310 | 325 | 335 | 293 | 295 |
| 2019 | 256 | 231 | 320 | 268 | 327 | 259 | 300 | 345 | 211 | 298 | 307 | 276 |
| 2020 | 222 | 280 | 202 | 131 | 284 | 230 | 231 | 236 | 152 | 172 | 131 | 205 |
| 2021 | 209 | 222 | 333 | 172 | 71 | 27 | 7 | 1 | 2 | 0 | 0 | 0 |
| 2022 | 0 | 0 | 0 | 0 | 0 | 0 | 0 | 0 | 0 | 0 | 0 | 0 |
| 2023 | 0 | 0 | 0 | 0 | 0 | 0 | 0 | 0 | 0 | 0 | 0 | 0 |
| 2024 | 0 | 0 | 0 | 0 | 0 | 0 | 0 | 0 | 0 | 0 | 0 | 0 |
| 2025 | - | - | - | - | - | - | - | - | - | - | - | - |
| Total | 5,095 | 5,466 | 6,905 | 6,331 | 7,405 | 8,837 | 7,667 | 8,320 | 5,932 | 6,117 | 5,888 | 5,704 |
Loading, please wait
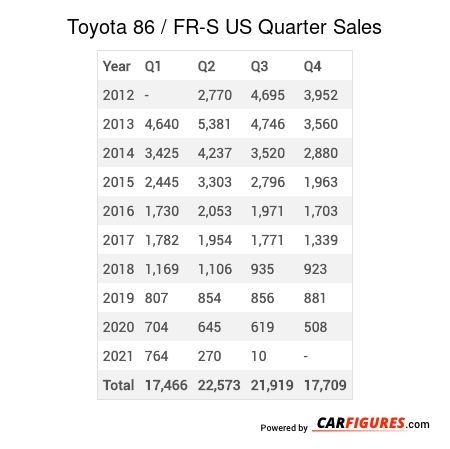
Year | Q1 | Q2 | Q3 | Q4 |
|---|---|---|---|---|
| 2012 | - | 2,770 | 4,695 | 3,952 |
| 2013 | 4,640 | 5,381 | 4,746 | 3,560 |
| 2014 | 3,425 | 4,237 | 3,520 | 2,880 |
| 2015 | 2,445 | 3,303 | 2,796 | 1,963 |
| 2016 | 1,730 | 2,053 | 1,971 | 1,703 |
| 2017 | 1,782 | 1,954 | 1,771 | 1,339 |
| 2018 | 1,169 | 1,106 | 935 | 923 |
| 2019 | 807 | 854 | 856 | 881 |
| 2020 | 704 | 645 | 619 | 508 |
| 2021 | 764 | 270 | 10 | 0 |
| 2022 | 0 | 0 | 0 | 0 |
| 2023 | 0 | 0 | 0 | 0 |
| 2024 | 0 | 0 | 0 | 0 |
| 2025 | - | - | - | - |
| Total | 17,466 | 22,573 | 21,919 | 17,709 |
Loading, please wait
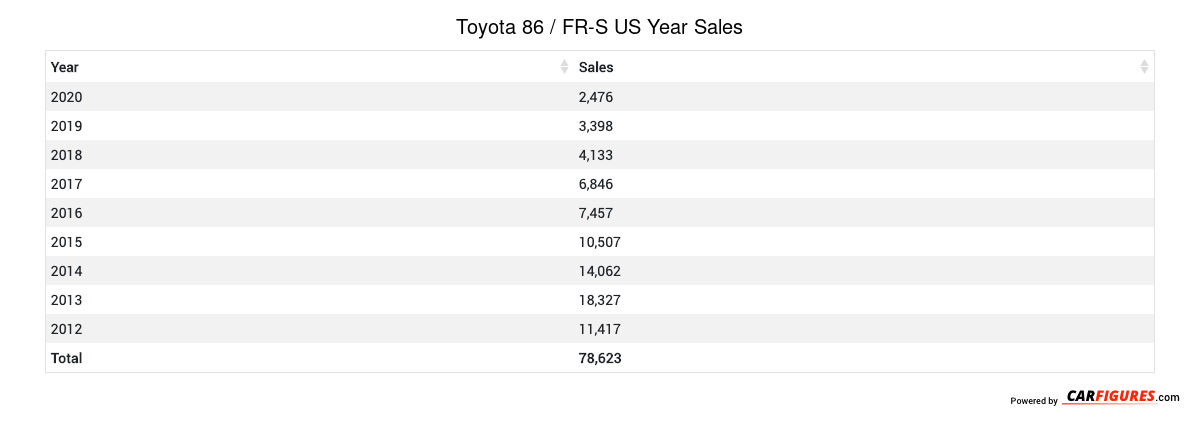
Year | Sales |
|---|---|
| 2021 | 1,044 |
| 2020 | 2,476 |
| 2019 | 3,398 |
| 2018 | 4,133 |
| 2017 | 6,846 |
| 2016 | 7,457 |
| 2015 | 10,507 |
| 2014 | 14,062 |
| 2013 | 18,327 |
| 2012 | 11,417 |
| Total | 79,667 |
Download Historic Sales Data
Embedded Code
See more widgetsSources: Manufacturers