Last updated: January 03, 2025
Overview
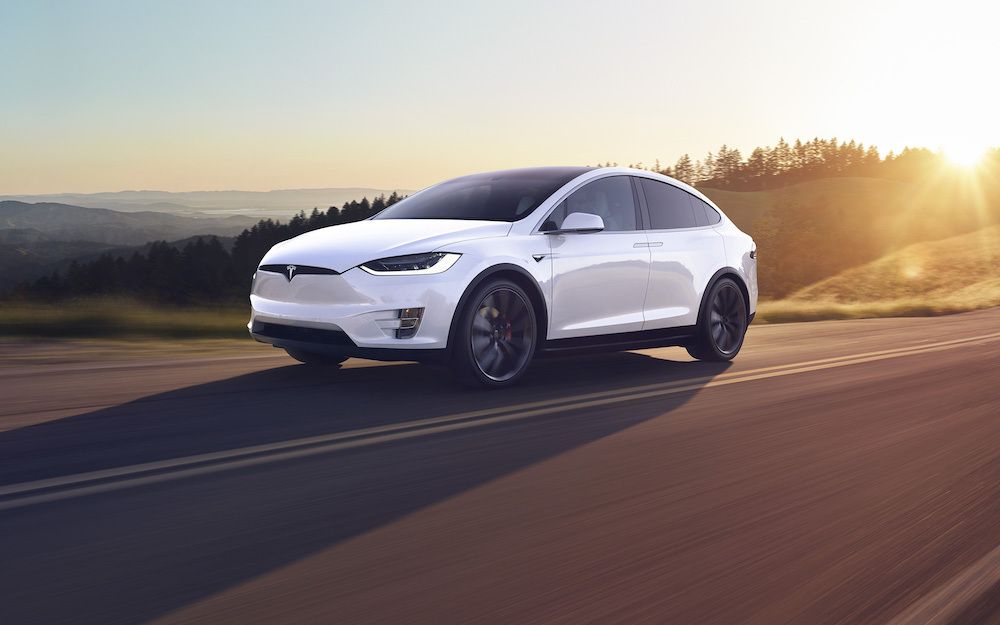
The 2022 Tesla Model X is a vehicle from automaker Tesla.
How Much Does the 2022 Tesla Model X Cost?
The 2022 Tesla Model X starts at $119,990 MSRP.
Tesla Model X Engine, Transmission, and Performance Numbers
List of Tesla Model X Competitors
Some of Tesla Model X competitors include the BMW X5, Mercedes-Benz GLE-Class and Tesla Model S.
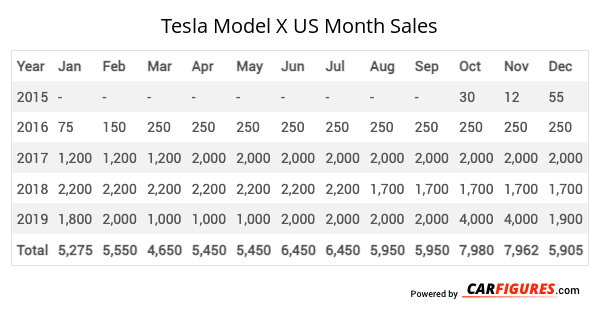
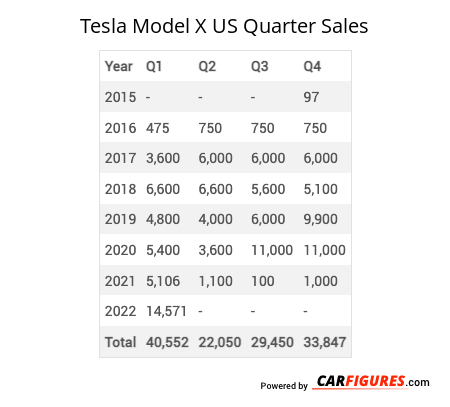
Tesla Model X United States Sale figures by year, quarter, and month are presented below. Including the most up to date sales data for the Tesla Model X. See how the Tesla Model X stacks up the other models in the Crossover/SUVS, Electric Vehicles, Premium Midsize Crossover/SUVs segments.
*Tesla does not provide detailed sales figures. These sales figures are estimates.
For sales numbers of the Tesla Model X in Canada, click here.
Loading, please wait
Year | Jan | Feb | Mar | Apr | May | Jun | Jul | Aug | Sep | Oct | Nov | Dec |
|---|---|---|---|---|---|---|---|---|---|---|---|---|
| 2015 | - | - | - | - | - | - | - | - | - | 30 | 12 | 55 |
| 2016 | 75 | 150 | 250 | 250 | 250 | 250 | 250 | 250 | 250 | 250 | 250 | 250 |
| 2017 | 1,200 | 1,200 | 1,200 | 2,000 | 2,000 | 2,000 | 2,000 | 2,000 | 2,000 | 2,000 | 2,000 | 2,000 |
| 2018 | 2,200 | 2,200 | 2,200 | 2,200 | 2,200 | 2,200 | 2,200 | 1,700 | 1,700 | 1,700 | 1,700 | 1,700 |
| 2019 | 1,800 | 2,000 | 1,000 | 1,000 | 1,000 | 2,000 | 2,000 | 2,000 | 2,000 | 4,000 | 4,000 | 1,900 |
| Total | 5,275 | 5,550 | 4,650 | 5,450 | 5,450 | 6,450 | 6,450 | 5,950 | 5,950 | 7,980 | 7,962 | 5,905 |
Loading, please wait
Year | Q1 | Q2 | Q3 | Q4 |
|---|---|---|---|---|
| 2015 | - | - | - | 97 |
| 2016 | 475 | 750 | 750 | 750 |
| 2017 | 3,600 | 6,000 | 6,000 | 6,000 |
| 2018 | 6,600 | 6,600 | 5,600 | 5,100 |
| 2019 | 4,800 | 4,000 | 6,000 | 9,900 |
| 2020 | 5,400 | 3,600 | 11,000 | 11,000 |
| 2021 | 5,106 | 1,100 | 100 | 1,000 |
| 2022 | 14,571 | 7,000 | 0 | 9,800 |
| 2023 | 6,001 | 0 | 0 | 0 |
| 2024 | 0 | 0 | 0 | 0 |
| 2025 | - | - | - | - |
| Total | 46,553 | 29,050 | 29,450 | 43,647 |
Loading, please wait
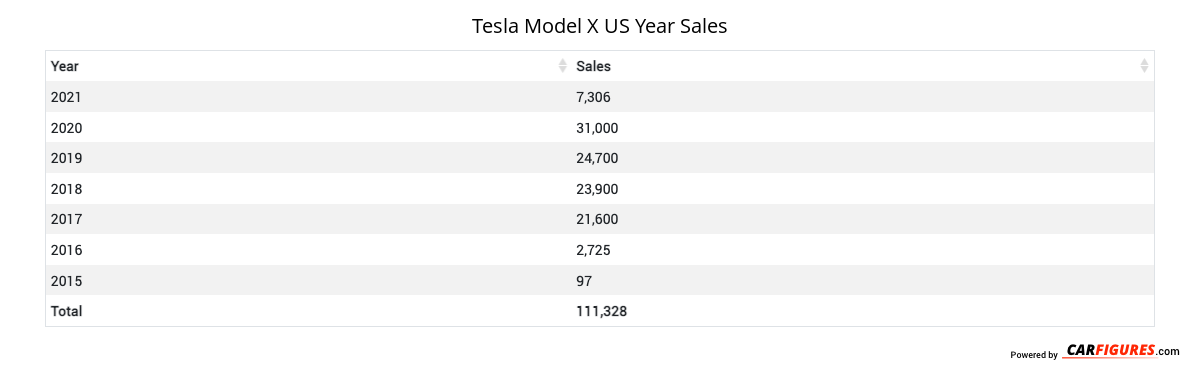
Year | Sales |
|---|---|
| 2023 | 6,001 |
| 2022 | 31,371 |
| 2021 | 7,306 |
| 2020 | 31,000 |
| 2019 | 24,700 |
| 2018 | 23,900 |
| 2017 | 21,600 |
| 2016 | 2,725 |
| 2015 | 97 |
| Total | 148,700 |
Download Historic Sales Data
Embedded Code
See more widgetsSources: Manufacturers