
Key Stats
How many ProMaster did Ram sell in 2024?
Ram sold 35,151 ProMaster in 2024. In 2023, Ram sold 37,894 ProMaster. They sold 2,743 more units in year 2023 compared to 2024 with a percent loss of 7.24% YoY.
Overview
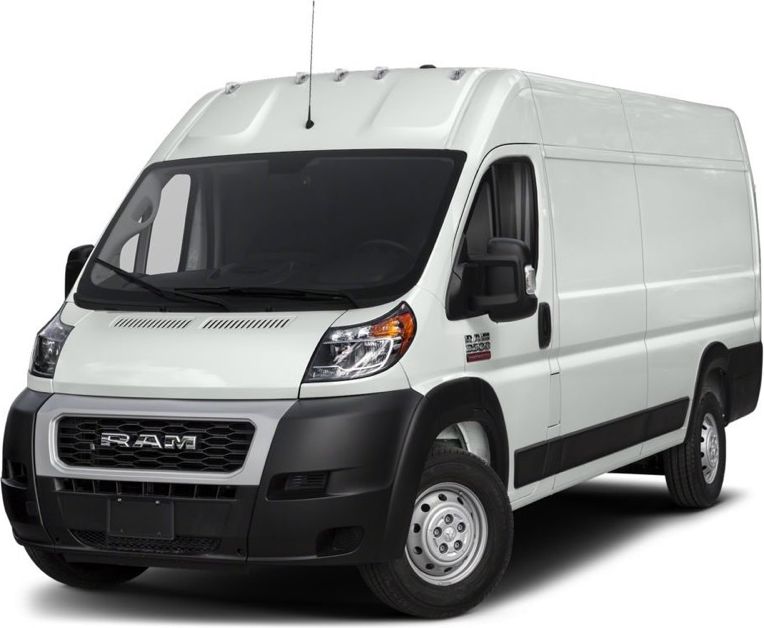
The 2022 RAM ProMaster 1500 is a vehicle from automaker Ram.
RAM ProMaster 1500 Engine, Transmission, and Performance Numbers
RAM ProMaster 1500 is powered by a 3.6-liter engine with a Front Wheel Drive powertrain that makes 280 -hp and 260 lb-ft torque. The transmission on the RAM ProMaster 1500 is an 9-Speed 948TE Automatic (STD).
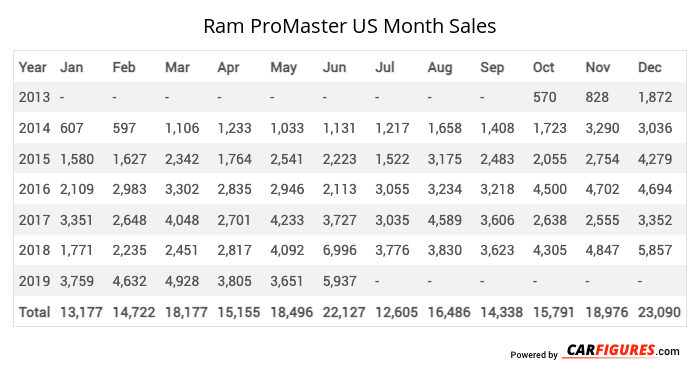
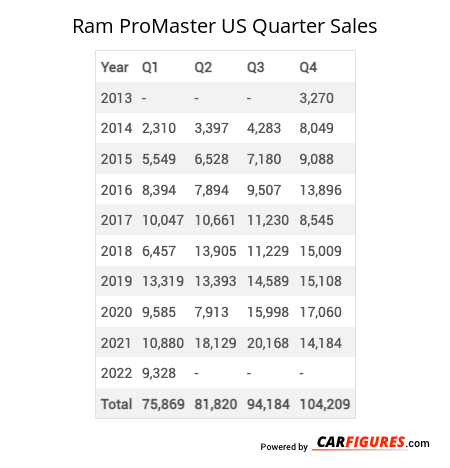
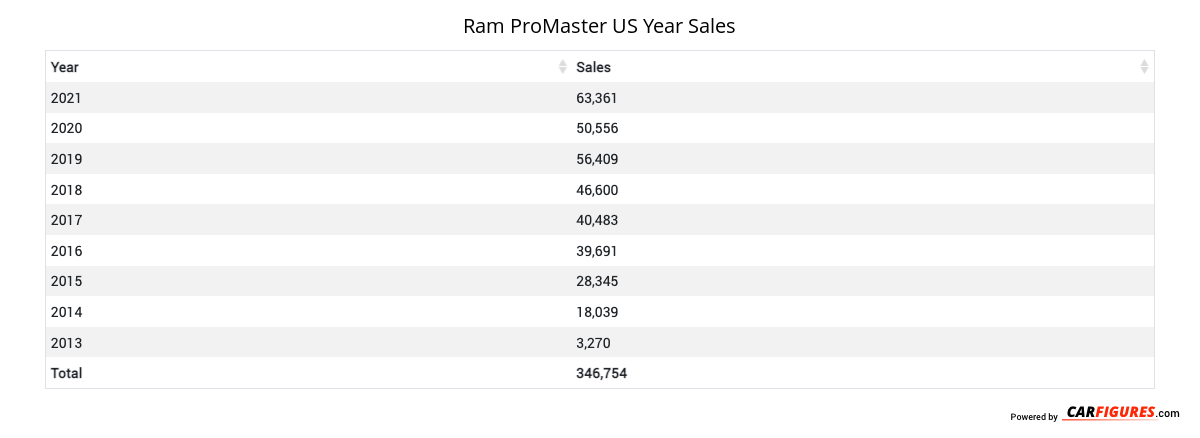
Ram ProMaster United States Sale figures by year, quarter, and month are presented below. Including the most up to date sales data for the Ram ProMaster. See how the Ram ProMaster stacks up the other models in the Cargo/Passenger Vans, Vans segments.
Year | Jan | Feb | Mar | Apr | May | Jun | Jul | Aug | Sep | Oct | Nov | Dec |
|---|---|---|---|---|---|---|---|---|---|---|---|---|
| 2013 | - | - | - | - | - | - | - | - | - | 570 | 828 | 1,872 |
| 2014 | 607 | 597 | 1,106 | 1,233 | 1,033 | 1,131 | 1,217 | 1,658 | 1,408 | 1,723 | 3,290 | 3,036 |
| 2015 | 1,580 | 1,627 | 2,342 | 1,764 | 2,541 | 2,223 | 1,522 | 3,175 | 2,483 | 2,055 | 2,754 | 4,279 |
| 2016 | 2,109 | 2,983 | 3,302 | 2,835 | 2,946 | 2,113 | 3,055 | 3,234 | 3,218 | 4,500 | 4,702 | 4,694 |
| 2017 | 3,351 | 2,648 | 4,048 | 2,701 | 4,233 | 3,727 | 3,035 | 4,589 | 3,606 | 2,638 | 2,555 | 3,352 |
| 2018 | 1,771 | 2,235 | 2,451 | 2,817 | 4,092 | 6,996 | 3,776 | 3,830 | 3,623 | 4,305 | 4,847 | 5,857 |
| 2019 | 3,759 | 4,632 | 4,928 | 3,805 | 3,651 | 5,937 | - | - | - | - | - | - |
| Total | 13,177 | 14,722 | 18,177 | 15,155 | 18,496 | 22,127 | 12,605 | 16,486 | 14,338 | 15,791 | 18,976 | 23,090 |
Year | Q1 | Q2 | Q3 | Q4 |
|---|---|---|---|---|
| 2013 | - | - | - | 3,270 |
| 2014 | 2,310 | 3,397 | 4,283 | 8,049 |
| 2015 | 5,549 | 6,528 | 7,180 | 9,088 |
| 2016 | 8,394 | 7,894 | 9,507 | 13,896 |
| 2017 | 10,047 | 10,661 | 11,230 | 8,545 |
| 2018 | 6,457 | 13,905 | 11,229 | 15,009 |
| 2019 | 13,319 | 13,393 | 14,589 | 15,108 |
| 2020 | 9,585 | 7,913 | 15,998 | 17,060 |
| 2021 | 10,880 | 18,129 | 20,168 | 14,184 |
| 2022 | 9,328 | 15,961 | 16,742 | 18,906 |
| 2023 | 17,694 | 20,200 | 0 | 0 |
| 2024 | 0 | 15,370 | 19,781 | 0 |
| 2025 | - | - | - | - |
| Total | 93,563 | 133,351 | 130,707 | 123,115 |
Year | Sales |
|---|---|
| 2024 | 35,151 |
| 2023 | 37,894 |
| 2022 | 60,937 |
| 2021 | 63,361 |
| 2020 | 50,556 |
| 2019 | 56,409 |
| 2018 | 46,600 |
| 2017 | 40,483 |
| 2016 | 39,691 |
| 2015 | 28,345 |
| 2014 | 18,039 |
| 2013 | 3,270 |
| Total | 480,736 |
Download Historic Sales Data
Embedded Code
See more widgetsSources: Manufacturers