Key Stats
How many Versa did Nissan sell in 2024?
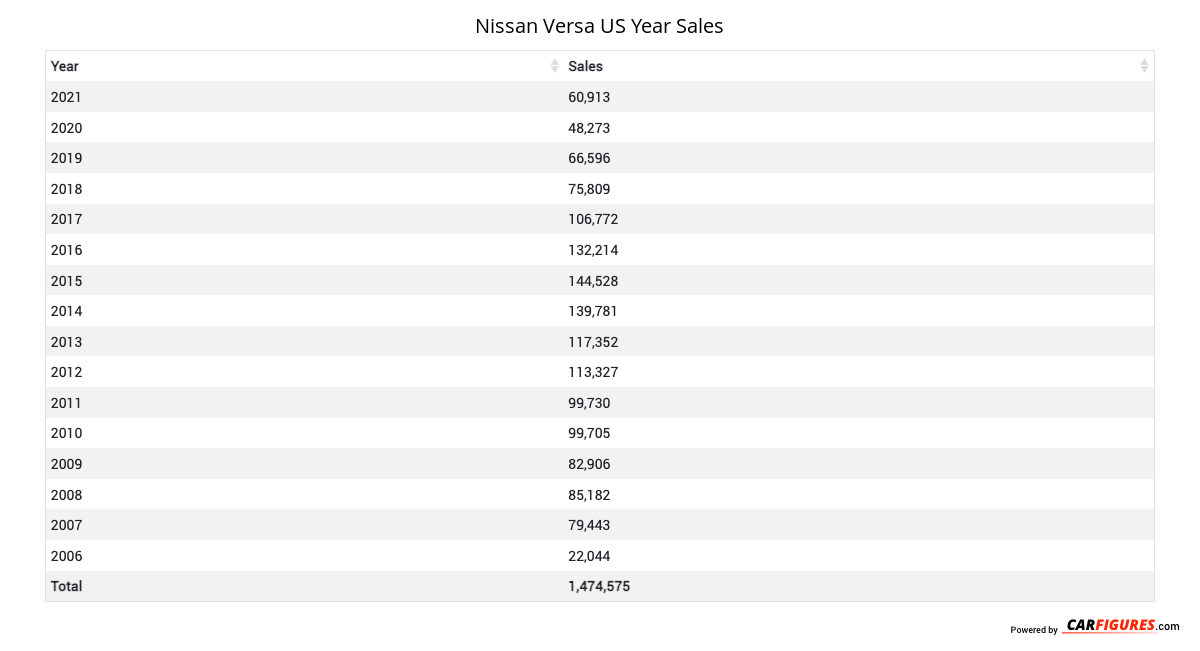
Nissan sold 29,303 Versa in 2024. In 2023, Nissan sold 20,163 Versa. They sold 9,140 more units in 2024 compared to 2023 with a percent gain of 45.33% YoY.
Overview
The 2022 Nissan Versa is a vehicle from automaker Nissan.
How Much Does the 2022 Nissan Versa Cost?
Pricing for the 2022 Nissan Versa starts at $15,080 MSRP and goes up to $18,490 fully loaded.
Nissan Versa Engine, Transmission, and Performance Numbers
Nissan Versa includes a 1.6-liter engine combined with a 5-Speed Manual. This delivers 122 hp with 114 lb-ft torque delivered through a Front Wheel Drive drivetrain.
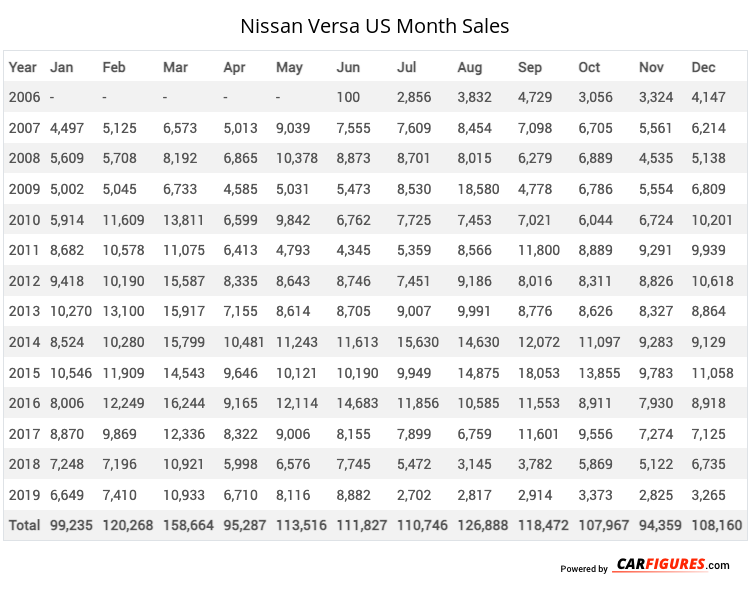
Nissan Versa United States Sale figures by year, quarter, and month are presented below. Including the most up to date sales data for the Nissan Versa. See how the Nissan Versa stacks up the other models in the Cars, Compact Cars segments.
Year | Jan | Feb | Mar | Apr | May | Jun | Jul | Aug | Sep | Oct | Nov | Dec |
|---|---|---|---|---|---|---|---|---|---|---|---|---|
| 2006 | - | - | - | - | - | 100 | 2,856 | 3,832 | 4,729 | 3,056 | 3,324 | 4,147 |
| 2007 | 4,497 | 5,125 | 6,573 | 5,013 | 9,039 | 7,555 | 7,609 | 8,454 | 7,098 | 6,705 | 5,561 | 6,214 |
| 2008 | 5,609 | 5,708 | 8,192 | 6,865 | 10,378 | 8,873 | 8,701 | 8,015 | 6,279 | 6,889 | 4,535 | 5,138 |
| 2009 | 5,002 | 5,045 | 6,733 | 4,585 | 5,031 | 5,473 | 8,530 | 18,580 | 4,778 | 6,786 | 5,554 | 6,809 |
| 2010 | 5,914 | 11,609 | 13,811 | 6,599 | 9,842 | 6,762 | 7,725 | 7,453 | 7,021 | 6,044 | 6,724 | 10,201 |
| 2011 | 8,682 | 10,578 | 11,075 | 6,413 | 4,793 | 4,345 | 5,359 | 8,566 | 11,800 | 8,889 | 9,291 | 9,939 |
| 2012 | 9,418 | 10,190 | 15,587 | 8,335 | 8,643 | 8,746 | 7,451 | 9,186 | 8,016 | 8,311 | 8,826 | 10,618 |
| 2013 | 10,270 | 13,100 | 15,917 | 7,155 | 8,614 | 8,705 | 9,007 | 9,991 | 8,776 | 8,626 | 8,327 | 8,864 |
| 2014 | 8,524 | 10,280 | 15,799 | 10,481 | 11,243 | 11,613 | 15,630 | 14,630 | 12,072 | 11,097 | 9,283 | 9,129 |
| 2015 | 10,546 | 11,909 | 14,543 | 9,646 | 10,121 | 10,190 | 9,949 | 14,875 | 18,053 | 13,855 | 9,783 | 11,058 |
| 2016 | 8,006 | 12,249 | 16,244 | 9,165 | 12,114 | 14,683 | 11,856 | 10,585 | 11,553 | 8,911 | 7,930 | 8,918 |
| 2017 | 8,870 | 9,869 | 12,336 | 8,322 | 9,006 | 8,155 | 7,899 | 6,759 | 11,601 | 9,556 | 7,274 | 7,125 |
| 2018 | 7,248 | 7,196 | 10,921 | 5,998 | 6,576 | 7,745 | 5,472 | 3,145 | 3,782 | 5,869 | 5,122 | 6,735 |
| 2019 | 6,649 | 7,410 | 10,933 | 6,710 | 8,116 | 8,882 | 2,702 | 2,817 | 2,914 | 3,373 | 2,825 | 3,265 |
| Total | 99,235 | 120,268 | 158,664 | 95,287 | 113,516 | 111,827 | 110,746 | 126,888 | 118,472 | 107,967 | 94,359 | 108,160 |
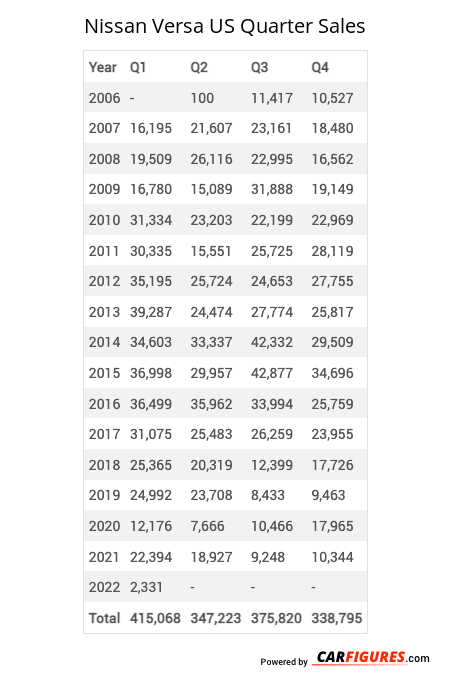
Year | Q1 | Q2 | Q3 | Q4 |
|---|---|---|---|---|
| 2006 | - | 100 | 11,417 | 10,527 |
| 2007 | 16,195 | 21,607 | 23,161 | 18,480 |
| 2008 | 19,509 | 26,116 | 22,995 | 16,562 |
| 2009 | 16,780 | 15,089 | 31,888 | 19,149 |
| 2010 | 31,334 | 23,203 | 22,199 | 22,969 |
| 2011 | 30,335 | 15,551 | 25,725 | 28,119 |
| 2012 | 35,195 | 25,724 | 24,653 | 27,755 |
| 2013 | 39,287 | 24,474 | 27,774 | 25,817 |
| 2014 | 34,603 | 33,337 | 42,332 | 29,509 |
| 2015 | 36,998 | 29,957 | 42,877 | 34,696 |
| 2016 | 36,499 | 35,962 | 33,994 | 25,759 |
| 2017 | 31,075 | 25,483 | 26,259 | 23,955 |
| 2018 | 25,365 | 20,319 | 12,399 | 17,726 |
| 2019 | 24,992 | 23,708 | 8,433 | 9,463 |
| 2020 | 12,176 | 7,666 | 10,466 | 17,965 |
| 2021 | 22,394 | 18,927 | 9,248 | 10,344 |
| 2022 | 2,331 | 3,296 | 3,710 | 4,062 |
| 2023 | 3,901 | 7,113 | 2,191 | 6,958 |
| 2024 | 7,475 | 10,338 | 11,490 | 0 |
| 2025 | - | - | - | - |
| Total | 426,444 | 367,970 | 393,211 | 349,815 |
Year | Sales |
|---|---|
| 2024 | 29,303 |
| 2023 | 20,163 |
| 2022 | 13,399 |
| 2021 | 60,913 |
| 2020 | 48,273 |
| 2019 | 66,596 |
| 2018 | 75,809 |
| 2017 | 106,772 |
| 2016 | 132,214 |
| 2015 | 144,528 |
| 2014 | 139,781 |
| 2013 | 117,352 |
| 2012 | 113,327 |
| 2011 | 99,730 |
| 2010 | 99,705 |
| 2009 | 82,906 |
| 2008 | 85,182 |
| 2007 | 79,443 |
| 2006 | 22,044 |
| Total | 1,537,440 |
Download Historic Sales Data
Embedded Code
See more widgetsSources: Manufacturers