Key Stats
How many Maxima did Nissan sell in 2024?
Nissan sold 922 Maxima in 2024. In 2023, Nissan sold 7,959 Maxima. They sold 7,037 more units in year 2023 compared to 2024 with a percent loss of 88.42% YoY.
Overview
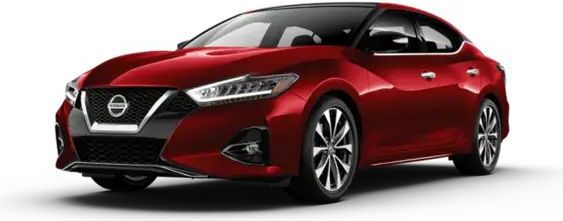
The 2022 Nissan Maxima is a vehicle from automaker Nissan.
How Much Does the 2022 Nissan Maxima Cost?
Pricing for the 2022 Nissan Maxima starts at $37,240 MSRP and goes up to $42,550 fully loaded.
Nissan Maxima Engine, Transmission, and Performance Numbers
Nissan Maxima includes a 3.5-liter engine combined with a Xtronic Continuously Variable (CVT). This delivers 300 hp with 261 lb-ft torque delivered through a Front Wheel Drive drivetrain.
List of Nissan Maxima Competitors
Some of Nissan Maxima competitors include the Toyota Camry, Honda Accord and Volkswagen Passat.
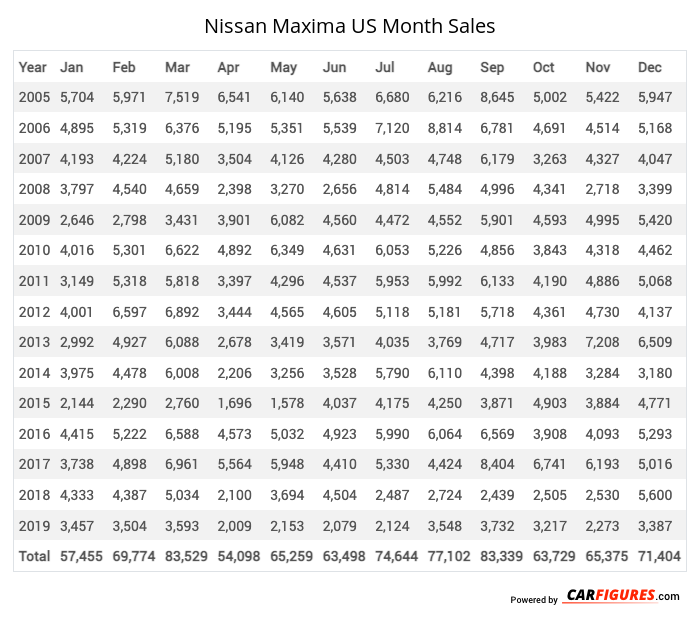
Nissan Maxima United States Sale figures by year, quarter, and month are presented below. Including the most up to date sales data for the Nissan Maxima. See how the Nissan Maxima stacks up the other models in the Cars, Midsize Cars segments.
Year | Jan | Feb | Mar | Apr | May | Jun | Jul | Aug | Sep | Oct | Nov | Dec |
|---|---|---|---|---|---|---|---|---|---|---|---|---|
| 2005 | 5,704 | 5,971 | 7,519 | 6,541 | 6,140 | 5,638 | 6,680 | 6,216 | 8,645 | 5,002 | 5,422 | 5,947 |
| 2006 | 4,895 | 5,319 | 6,376 | 5,195 | 5,351 | 5,539 | 7,120 | 8,814 | 6,781 | 4,691 | 4,514 | 5,168 |
| 2007 | 4,193 | 4,224 | 5,180 | 3,504 | 4,126 | 4,280 | 4,503 | 4,748 | 6,179 | 3,263 | 4,327 | 4,047 |
| 2008 | 3,797 | 4,540 | 4,659 | 2,398 | 3,270 | 2,656 | 4,814 | 5,484 | 4,996 | 4,341 | 2,718 | 3,399 |
| 2009 | 2,646 | 2,798 | 3,431 | 3,901 | 6,082 | 4,560 | 4,472 | 4,552 | 5,901 | 4,593 | 4,995 | 5,420 |
| 2010 | 4,016 | 5,301 | 6,622 | 4,892 | 6,349 | 4,631 | 6,053 | 5,226 | 4,856 | 3,843 | 4,318 | 4,462 |
| 2011 | 3,149 | 5,318 | 5,818 | 3,397 | 4,296 | 4,537 | 5,953 | 5,992 | 6,133 | 4,190 | 4,886 | 5,068 |
| 2012 | 4,001 | 6,597 | 6,892 | 3,444 | 4,565 | 4,605 | 5,118 | 5,181 | 5,718 | 4,361 | 4,730 | 4,137 |
| 2013 | 2,992 | 4,927 | 6,088 | 2,678 | 3,419 | 3,571 | 4,035 | 3,769 | 4,717 | 3,983 | 7,208 | 6,509 |
| 2014 | 3,975 | 4,478 | 6,008 | 2,206 | 3,256 | 3,528 | 5,790 | 6,110 | 4,398 | 4,188 | 3,284 | 3,180 |
| 2015 | 2,144 | 2,290 | 2,760 | 1,696 | 1,578 | 4,037 | 4,175 | 4,250 | 3,871 | 4,903 | 3,884 | 4,771 |
| 2016 | 4,415 | 5,222 | 6,588 | 4,573 | 5,032 | 4,923 | 5,990 | 6,064 | 6,569 | 3,908 | 4,093 | 5,293 |
| 2017 | 3,738 | 4,898 | 6,961 | 5,564 | 5,948 | 4,410 | 5,330 | 4,424 | 8,404 | 6,741 | 6,193 | 5,016 |
| 2018 | 4,333 | 4,387 | 5,034 | 2,100 | 3,694 | 4,504 | 2,487 | 2,724 | 2,439 | 2,505 | 2,530 | 5,600 |
| 2019 | 3,457 | 3,504 | 3,593 | 2,009 | 2,153 | 2,079 | 2,124 | 3,548 | 3,732 | 3,217 | 2,273 | 3,387 |
| Total | 57,455 | 69,774 | 83,529 | 54,098 | 65,259 | 63,498 | 74,644 | 77,102 | 83,339 | 63,729 | 65,375 | 71,404 |
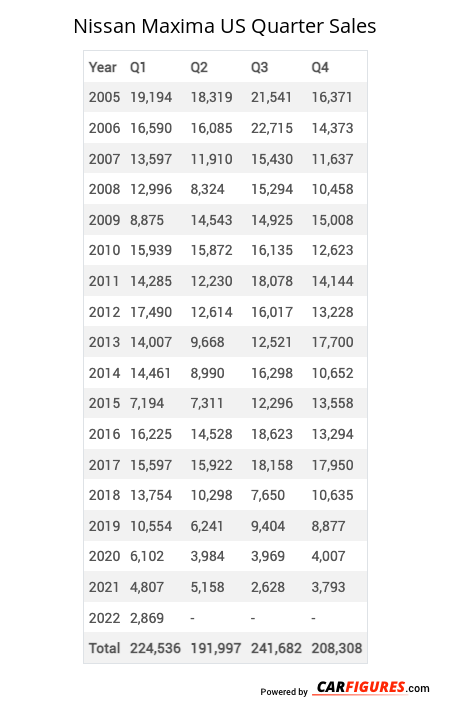
Year | Q1 | Q2 | Q3 | Q4 |
|---|---|---|---|---|
| 2005 | 19,194 | 18,319 | 21,541 | 16,371 |
| 2006 | 16,590 | 16,085 | 22,715 | 14,373 |
| 2007 | 13,597 | 11,910 | 15,430 | 11,637 |
| 2008 | 12,996 | 8,324 | 15,294 | 10,458 |
| 2009 | 8,875 | 14,543 | 14,925 | 15,008 |
| 2010 | 15,939 | 15,872 | 16,135 | 12,623 |
| 2011 | 14,285 | 12,230 | 18,078 | 14,144 |
| 2012 | 17,490 | 12,614 | 16,017 | 13,228 |
| 2013 | 14,007 | 9,668 | 12,521 | 17,700 |
| 2014 | 14,461 | 8,990 | 16,298 | 10,652 |
| 2015 | 7,194 | 7,311 | 12,296 | 13,558 |
| 2016 | 16,225 | 14,528 | 18,623 | 13,294 |
| 2017 | 15,597 | 15,922 | 18,158 | 17,950 |
| 2018 | 13,754 | 10,298 | 7,650 | 10,635 |
| 2019 | 10,554 | 6,241 | 9,404 | 8,877 |
| 2020 | 6,102 | 3,984 | 3,969 | 4,007 |
| 2021 | 4,807 | 5,158 | 2,628 | 3,793 |
| 2022 | 2,869 | 884 | 1,282 | 2,075 |
| 2023 | 2,207 | 3,971 | 799 | 982 |
| 2024 | 529 | 284 | 109 | 0 |
| 2025 | - | - | - | - |
| Total | 227,272 | 197,136 | 243,872 | 211,365 |
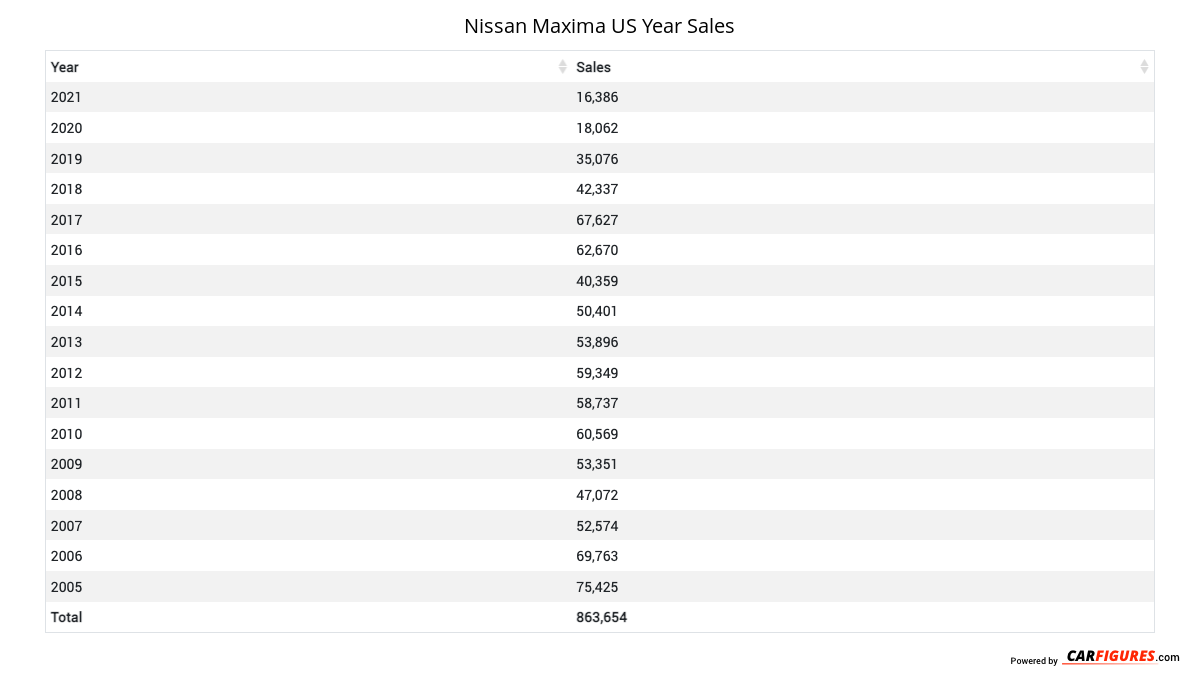
Year | Sales |
|---|---|
| 2024 | 922 |
| 2023 | 7,959 |
| 2022 | 7,110 |
| 2021 | 16,386 |
| 2020 | 18,062 |
| 2019 | 35,076 |
| 2018 | 42,337 |
| 2017 | 67,627 |
| 2016 | 62,670 |
| 2015 | 40,359 |
| 2014 | 50,401 |
| 2013 | 53,896 |
| 2012 | 59,349 |
| 2011 | 58,737 |
| 2010 | 60,569 |
| 2009 | 53,351 |
| 2008 | 47,072 |
| 2007 | 52,574 |
| 2006 | 69,763 |
| 2005 | 75,425 |
| Total | 879,645 |
Download Historic Sales Data
Embedded Code
See more widgetsSources: Manufacturers