Key Stats
How many Leaf did Nissan sell in 2024?
Nissan sold 7,582 Leaf in 2024. In 2023, Nissan sold 6,083 Leaf. They sold 1,499 more units in 2024 compared to 2023 with a percent gain of 24.64% YoY.
Overview
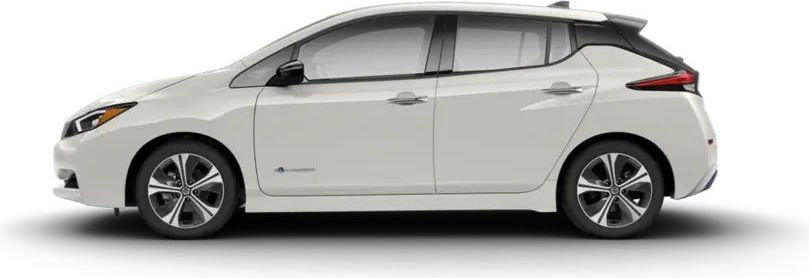
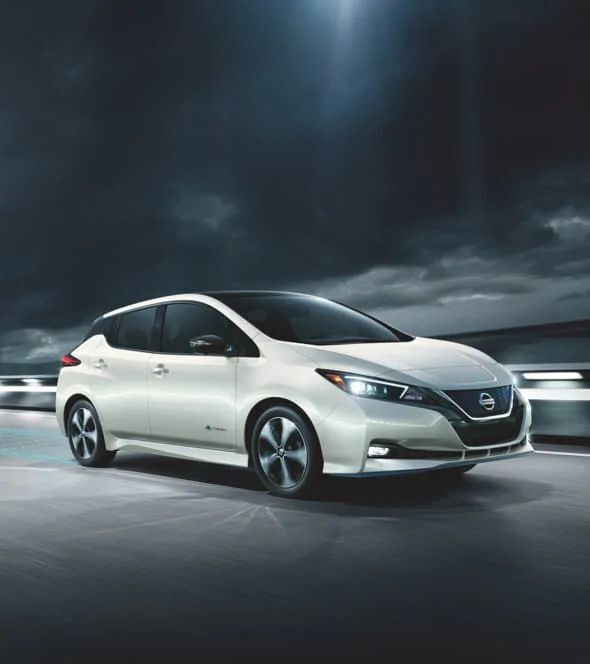
The 2022 Nissan Leaf is a vehicle from automaker Nissan.
How Much Does the 2022 Nissan Leaf Cost?
The 2022 Nissan Leaf starts at $27,400 MSRP. Fully loaded, the Nissan Leaf will cost you about $37,400.
Nissan Leaf Engine, Transmission, and Performance Numbers
Nissan Leaf is powered by a -liter engine with a Front Wheel Drive powertrain that makes 147 -hp and 236 lb-ft torque. The transmission on the Nissan Leaf is an Single Speed Reducer.
List of Nissan Leaf Competitors
Some of Nissan Leaf competitors include the Tesla Model 3.
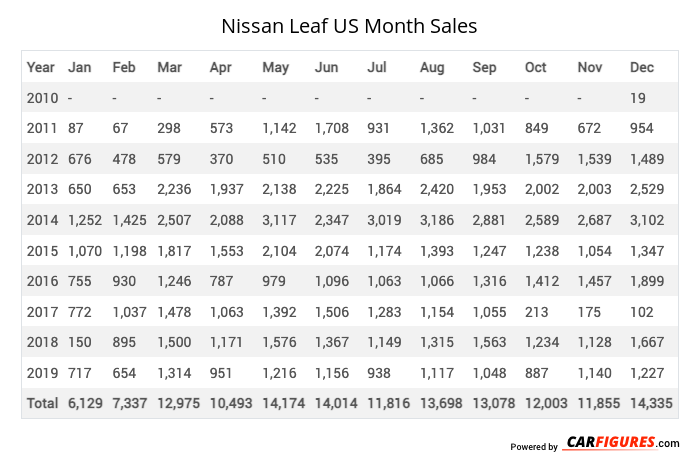
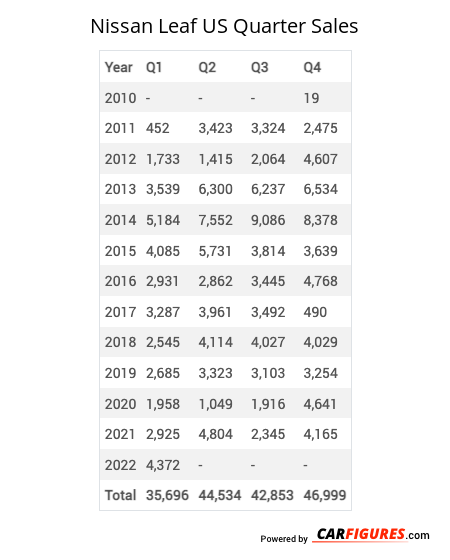
Nissan Leaf United States Sale figures by year, quarter, and month are presented below. Including the most up to date sales data for the Nissan Leaf. See how the Nissan Leaf stacks up the other models in the Cars, Compact Cars, Electric Vehicles segments.
Year | Jan | Feb | Mar | Apr | May | Jun | Jul | Aug | Sep | Oct | Nov | Dec |
|---|---|---|---|---|---|---|---|---|---|---|---|---|
| 2010 | - | - | - | - | - | - | - | - | - | - | - | 19 |
| 2011 | 87 | 67 | 298 | 573 | 1,142 | 1,708 | 931 | 1,362 | 1,031 | 849 | 672 | 954 |
| 2012 | 676 | 478 | 579 | 370 | 510 | 535 | 395 | 685 | 984 | 1,579 | 1,539 | 1,489 |
| 2013 | 650 | 653 | 2,236 | 1,937 | 2,138 | 2,225 | 1,864 | 2,420 | 1,953 | 2,002 | 2,003 | 2,529 |
| 2014 | 1,252 | 1,425 | 2,507 | 2,088 | 3,117 | 2,347 | 3,019 | 3,186 | 2,881 | 2,589 | 2,687 | 3,102 |
| 2015 | 1,070 | 1,198 | 1,817 | 1,553 | 2,104 | 2,074 | 1,174 | 1,393 | 1,247 | 1,238 | 1,054 | 1,347 |
| 2016 | 755 | 930 | 1,246 | 787 | 979 | 1,096 | 1,063 | 1,066 | 1,316 | 1,412 | 1,457 | 1,899 |
| 2017 | 772 | 1,037 | 1,478 | 1,063 | 1,392 | 1,506 | 1,283 | 1,154 | 1,055 | 213 | 175 | 102 |
| 2018 | 150 | 895 | 1,500 | 1,171 | 1,576 | 1,367 | 1,149 | 1,315 | 1,563 | 1,234 | 1,128 | 1,667 |
| 2019 | 717 | 654 | 1,314 | 951 | 1,216 | 1,156 | 938 | 1,117 | 1,048 | 887 | 1,140 | 1,227 |
| Total | 6,129 | 7,337 | 12,975 | 10,493 | 14,174 | 14,014 | 11,816 | 13,698 | 13,078 | 12,003 | 11,855 | 14,335 |
Year | Q1 | Q2 | Q3 | Q4 |
|---|---|---|---|---|
| 2010 | - | - | - | 19 |
| 2011 | 452 | 3,423 | 3,324 | 2,475 |
| 2012 | 1,733 | 1,415 | 2,064 | 4,607 |
| 2013 | 3,539 | 6,300 | 6,237 | 6,534 |
| 2014 | 5,184 | 7,552 | 9,086 | 8,378 |
| 2015 | 4,085 | 5,731 | 3,814 | 3,639 |
| 2016 | 2,931 | 2,862 | 3,445 | 4,768 |
| 2017 | 3,287 | 3,961 | 3,492 | 490 |
| 2018 | 2,545 | 4,114 | 4,027 | 4,029 |
| 2019 | 2,685 | 3,323 | 3,103 | 3,254 |
| 2020 | 1,958 | 1,049 | 1,916 | 4,641 |
| 2021 | 2,925 | 4,804 | 2,345 | 4,165 |
| 2022 | 4,372 | 3,251 | 1,276 | 3,127 |
| 2023 | 2,353 | 1,880 | 503 | 1,347 |
| 2024 | 1,143 | 1,925 | 4,514 | 0 |
| 2025 | - | - | - | - |
| Total | 39,192 | 51,590 | 49,146 | 51,473 |
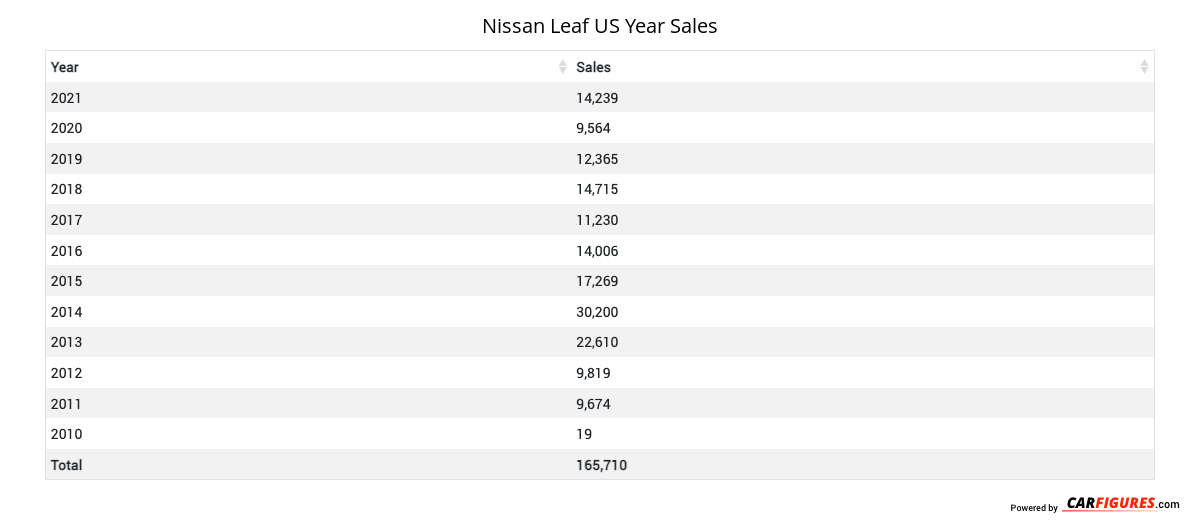
Year | Sales |
|---|---|
| 2024 | 7,582 |
| 2023 | 6,083 |
| 2022 | 12,026 |
| 2021 | 14,239 |
| 2020 | 9,564 |
| 2019 | 12,365 |
| 2018 | 14,715 |
| 2017 | 11,230 |
| 2016 | 14,006 |
| 2015 | 17,269 |
| 2014 | 30,200 |
| 2013 | 22,610 |
| 2012 | 9,819 |
| 2011 | 9,674 |
| 2010 | 19 |
| Total | 191,401 |
Download Historic Sales Data
Embedded Code
See more widgetsSources: Manufacturers