Key Stats
How many Mirage did Mitsubishi sell in 2024?
Mitsubishi sold 20,026 Mirage in 2024. In 2023, Mitsubishi sold 9,192 Mirage. They sold 10,834 more units in 2024 compared to 2023 with a percent gain of 117.86% YoY.
Overview
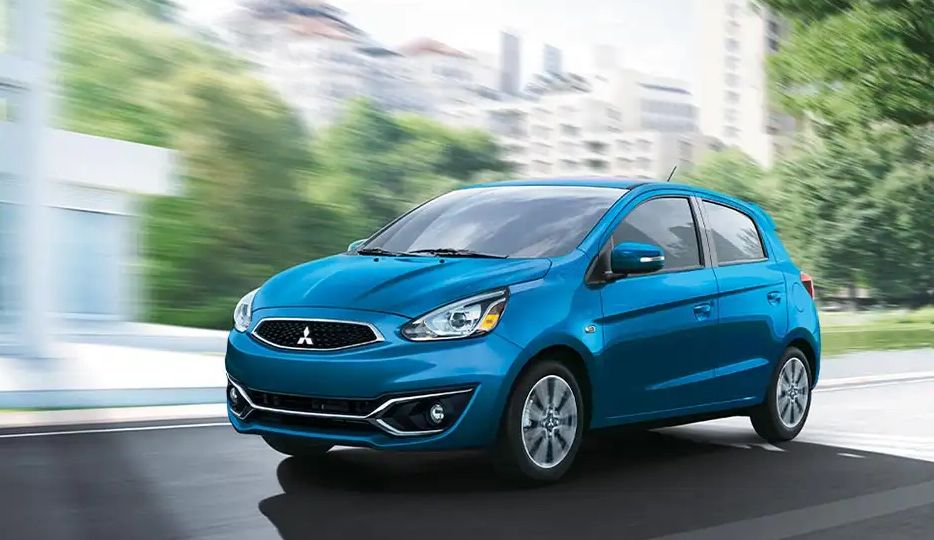
The 2022 Mitsubishi Mirage is a vehicle from automaker Mitsubishi.
How Much Does the 2022 Mitsubishi Mirage Cost?
The 2022 Mitsubishi Mirage starts at $14,645 MSRP. Fully loaded, the Mitsubishi Mirage will cost you about $17,895.
Mitsubishi Mirage Engine, Transmission, and Performance Numbers
Mitsubishi Mirage is powered by a 1.2-liter engine with a Front Wheel Drive powertrain that makes 78 -hp and 74 lb-ft torque. The transmission on the Mitsubishi Mirage is an 5-Speed Manual.
List of Mitsubishi Mirage Competitors
Some of Mitsubishi Mirage competitors include the Honda Fit, Chevrolet Spark and Kia Rio.
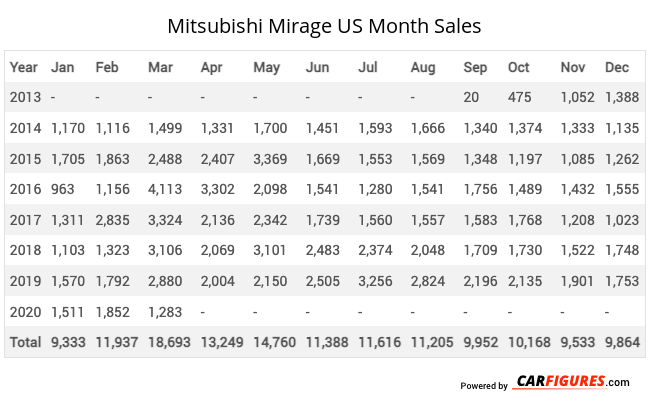
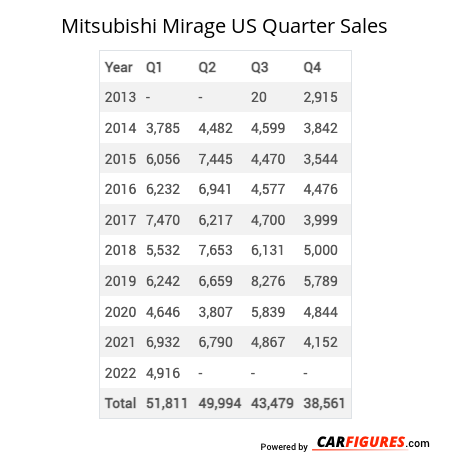
Mitsubishi Mirage United States Sale figures by year, quarter, and month are presented below. Including the most up to date sales data for the Mitsubishi Mirage. See how the Mitsubishi Mirage stacks up the other models in the Cars, Subcompact Cars segments.
Year | Jan | Feb | Mar | Apr | May | Jun | Jul | Aug | Sep | Oct | Nov | Dec |
|---|---|---|---|---|---|---|---|---|---|---|---|---|
| 2013 | - | - | - | - | - | - | - | - | 20 | 475 | 1,052 | 1,388 |
| 2014 | 1,170 | 1,116 | 1,499 | 1,331 | 1,700 | 1,451 | 1,593 | 1,666 | 1,340 | 1,374 | 1,333 | 1,135 |
| 2015 | 1,705 | 1,863 | 2,488 | 2,407 | 3,369 | 1,669 | 1,553 | 1,569 | 1,348 | 1,197 | 1,085 | 1,262 |
| 2016 | 963 | 1,156 | 4,113 | 3,302 | 2,098 | 1,541 | 1,280 | 1,541 | 1,756 | 1,489 | 1,432 | 1,555 |
| 2017 | 1,311 | 2,835 | 3,324 | 2,136 | 2,342 | 1,739 | 1,560 | 1,557 | 1,583 | 1,768 | 1,208 | 1,023 |
| 2018 | 1,103 | 1,323 | 3,106 | 2,069 | 3,101 | 2,483 | 2,374 | 2,048 | 1,709 | 1,730 | 1,522 | 1,748 |
| 2019 | 1,570 | 1,792 | 2,880 | 2,004 | 2,150 | 2,505 | 3,256 | 2,824 | 2,196 | 2,135 | 1,901 | 1,753 |
| 2020 | 1,511 | 1,852 | 1,283 | - | - | - | - | - | - | - | - | - |
| Total | 9,333 | 11,937 | 18,693 | 13,249 | 14,760 | 11,388 | 11,616 | 11,205 | 9,952 | 10,168 | 9,533 | 9,864 |
Year | Q1 | Q2 | Q3 | Q4 |
|---|---|---|---|---|
| 2013 | - | - | 20 | 2,915 |
| 2014 | 3,785 | 4,482 | 4,599 | 3,842 |
| 2015 | 6,056 | 7,445 | 4,470 | 3,544 |
| 2016 | 6,232 | 6,941 | 4,577 | 4,476 |
| 2017 | 7,470 | 6,217 | 4,700 | 3,999 |
| 2018 | 5,532 | 7,653 | 6,131 | 5,000 |
| 2019 | 6,242 | 6,659 | 8,276 | 5,789 |
| 2020 | 4,646 | 3,807 | 5,839 | 4,844 |
| 2021 | 6,932 | 6,790 | 4,867 | 4,152 |
| 2022 | 4,916 | 4,618 | 3,227 | 3,053 |
| 2023 | 3,341 | 1,975 | 0 | 3,876 |
| 2024 | 5,004 | 4,860 | 10,162 | 0 |
| 2025 | - | - | - | - |
| Total | 60,156 | 61,447 | 56,868 | 45,490 |
Year | Sales |
|---|---|
| 2024 | 20,026 |
| 2023 | 9,192 |
| 2022 | 15,814 |
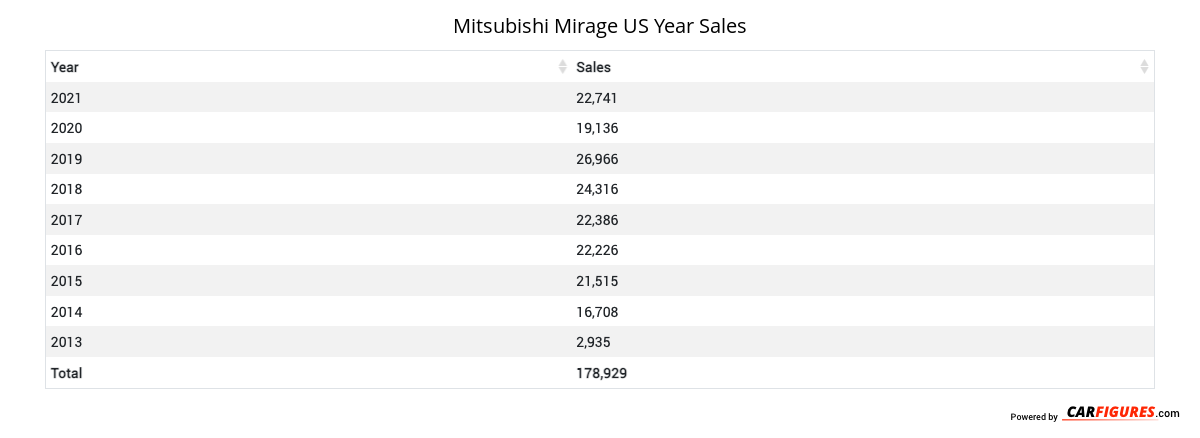
| 2021 | 22,741 |
| 2020 | 19,136 |
| 2019 | 26,966 |
| 2018 | 24,316 |
| 2017 | 22,386 |
| 2016 | 22,226 |
| 2015 | 21,515 |
| 2014 | 16,708 |
| 2013 | 2,935 |
| Total | 223,961 |
Download Historic Sales Data
Embedded Code
See more widgetsSources: Manufacturers