Last updated: October 02, 2024
Key Stats
How many cars did Mitsubishi sell in 2024?
Mitsubishi sold 82,722 vehicles in 2024. In 2023, Mitsubishi sold 65,146 vehicles. They sold 17,576 more vehicles in 2024 compared to 2023 with a percent gain of 26.98% YoY.
Mitsubishi Total US Sales Statistics by Year
Mitsubishi Total US Sales Statistics by Quarter
Current Lineup
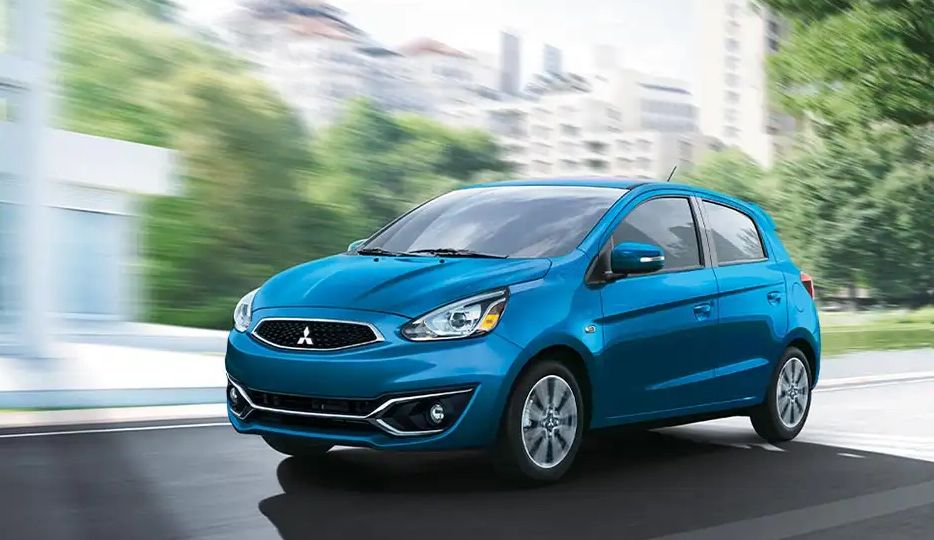


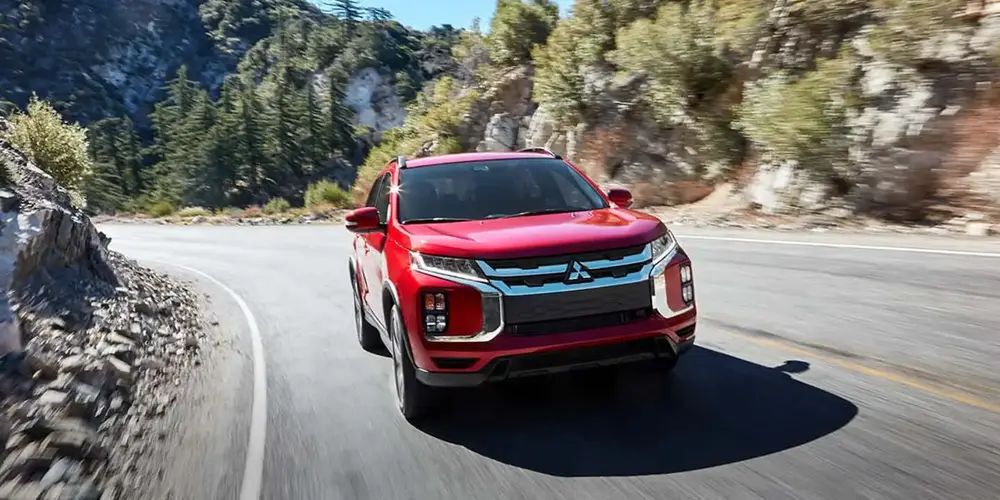
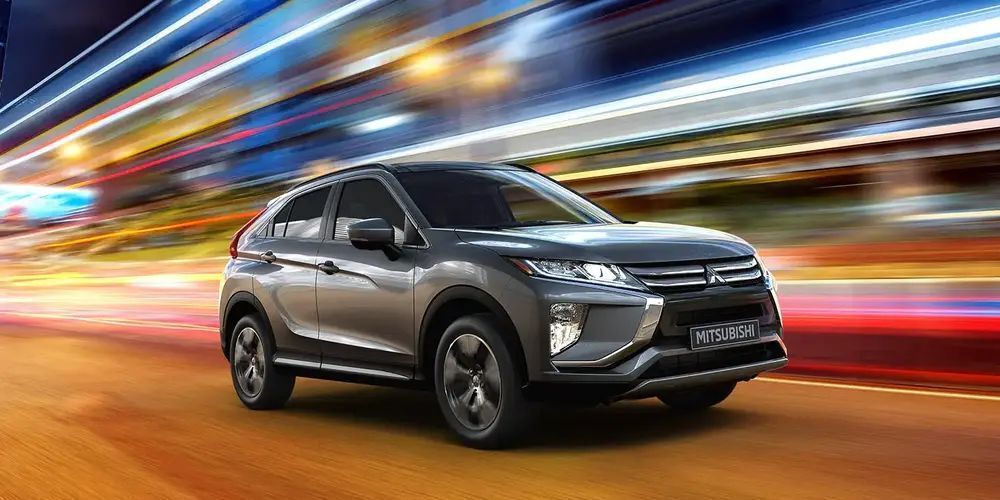
Discontinued Models
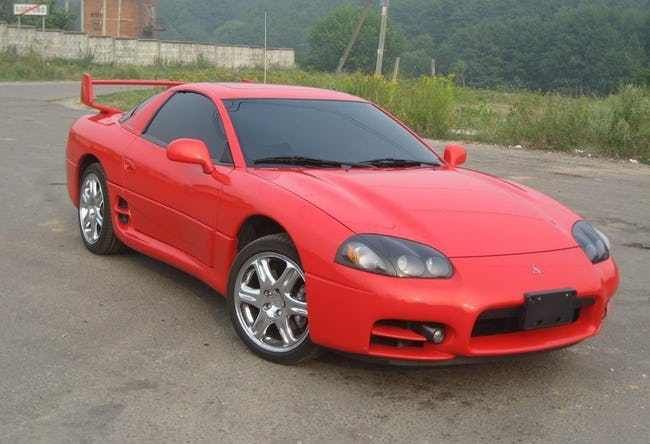
Mitsubishi includes the cars 1999 3000GT, 2012 Eclipse, 2024 Eclipse Cross, 2012 Galant, 2017 Lancer, 2024 Mirage, 2024 Outlander, 2024 Outlander PHEV, 2024 Outlander Sport
Loading, please wait
Year | Q1 | Q2 | Q3 | Q4 |
|---|---|---|---|---|
| 2005 | 26,226 | 24,263 | 24,079 | 20,298 |
| 2006 | 19,790 | 23,173 | 23,637 | 22,118 |
| 2007 | 24,530 | 32,070 | 27,278 | 17,428 |
| 2008 | 22,528 | 22,914 | 23,170 | 14,902 |
| 2009 | 11,268 | 10,427 | 14,492 | 10,215 |
| 2010 | 11,942 | 11,721 | 13,617 | 11,026 |
| 2011 | 14,523 | 13,632 | 13,167 | 8,426 |
| 2012 | 15,036 | 11,859 | 7,641 | 6,512 |
| 2013 | 9,885 | 7,162 | 8,338 | 10,769 |
| 2014 | 12,362 | 16,867 | 18,641 | 19,231 |
| 2015 | 23,775 | 25,697 | 23,692 | 22,063 |
| 2016 | 26,204 | 26,710 | 22,355 | 21,904 |
| 2017 | 29,143 | 25,427 | 24,619 | 24,392 |
| 2018 | 35,472 | 31,555 | 26,071 | 24,676 |
| 2019 | 42,073 | 29,030 | 24,474 | 25,475 |
| 2020 | 35,714 | 12,197 | 24,857 | 14,770 |
| 2021 | 28,231 | 25,146 | 23,799 | 24,861 |
| 2022 | 25,679 | 21,871 | 16,781 | 20,755 |
| 2023 | 20,935 | 24,603 | 0 | 19,608 |
| 2024 | 28,406 | - | - | - |
Loading, please wait
Year | Sales |
|---|---|
| 2024 | 82,722 |
| 2023 | 65,146 |
| 2022 | 85,086 |
| 2021 | 102,037 |
| 2020 | 87,538 |
| 2019 | 121,052 |
| 2018 | 117,774 |
| 2017 | 103,581 |
| 2016 | 97,173 |
| 2015 | 95,227 |
| 2014 | 67,101 |
| 2013 | 36,154 |
| 2012 | 41,048 |
| 2011 | 49,748 |
| 2010 | 48,306 |
| 2009 | 46,402 |
| 2008 | 83,514 |
| 2007 | 101,306 |
| 2006 | 88,718 |
| 2005 | 94,866 |
| Total | 1,614,499 |