Overview
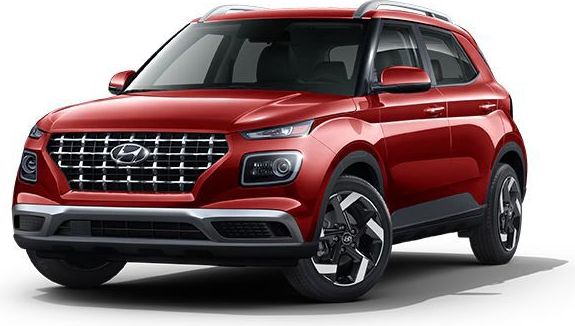
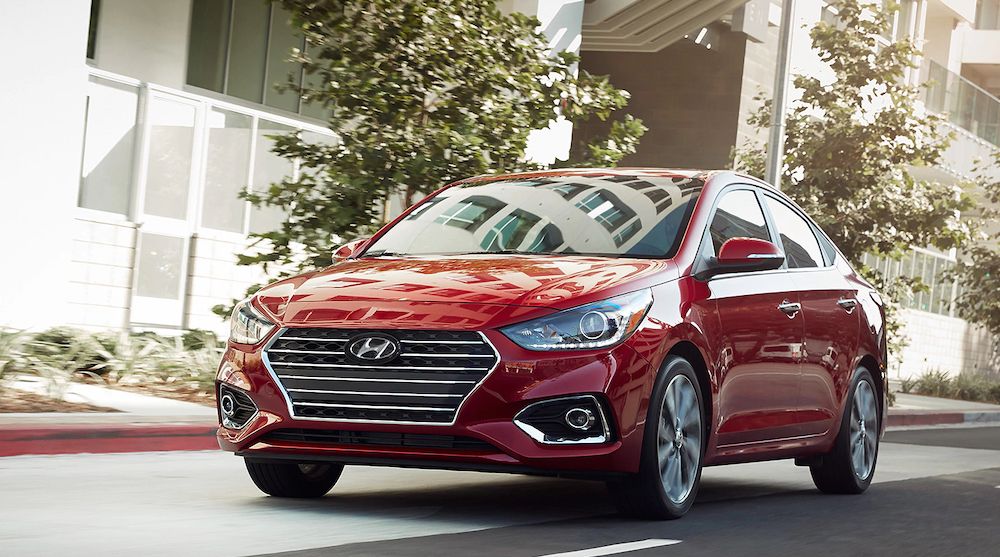
The 2022 Hyundai Accent is a vehicle from automaker Hyundai.
How Much Does the 2022 Hyundai Accent Cost?
Pricing for the 2022 Hyundai Accent starts at $16,645 MSRP and goes up to $19,600 fully loaded.
Hyundai Accent Engine, Transmission, and Performance Numbers
The Hyundai Accent includes a 1.6-liter coupled with a Smartstream Intelligent Variable (IVT) that delivers 120 hp and 113 lb-ft torque with a Front Wheel Drive drivetrain.
List of Hyundai Accent Competitors
Some of Hyundai Accent competitors include the Honda Fit, Kia Rio and Toyota Yaris.
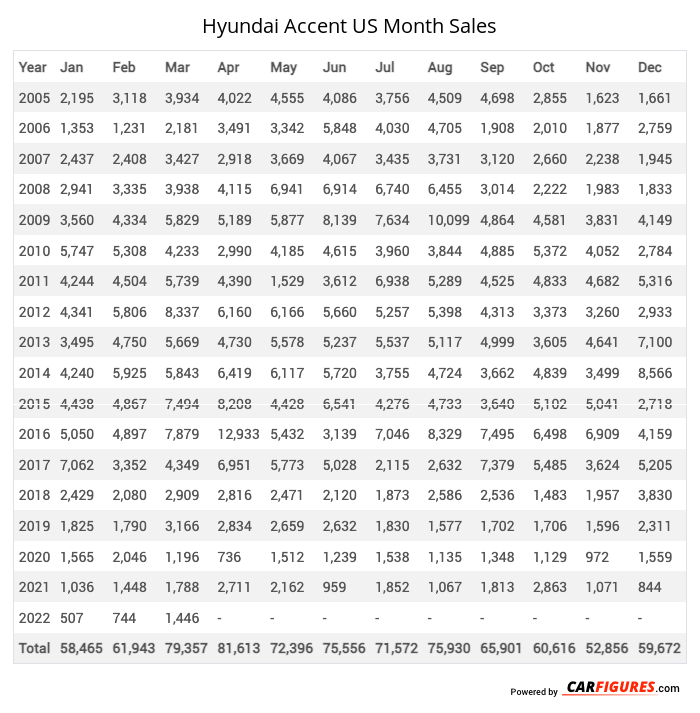
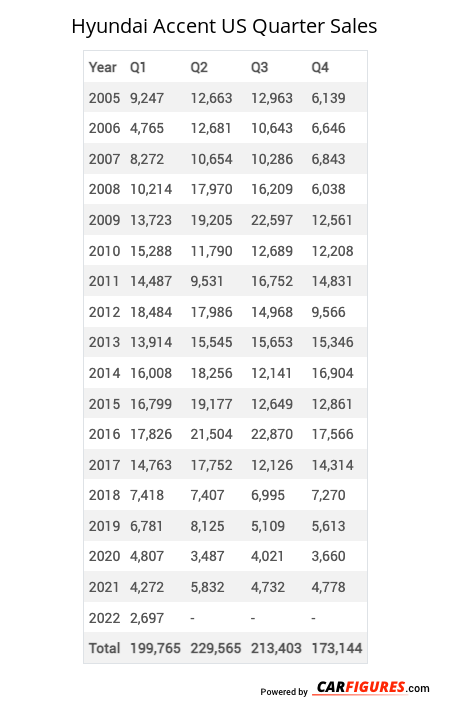
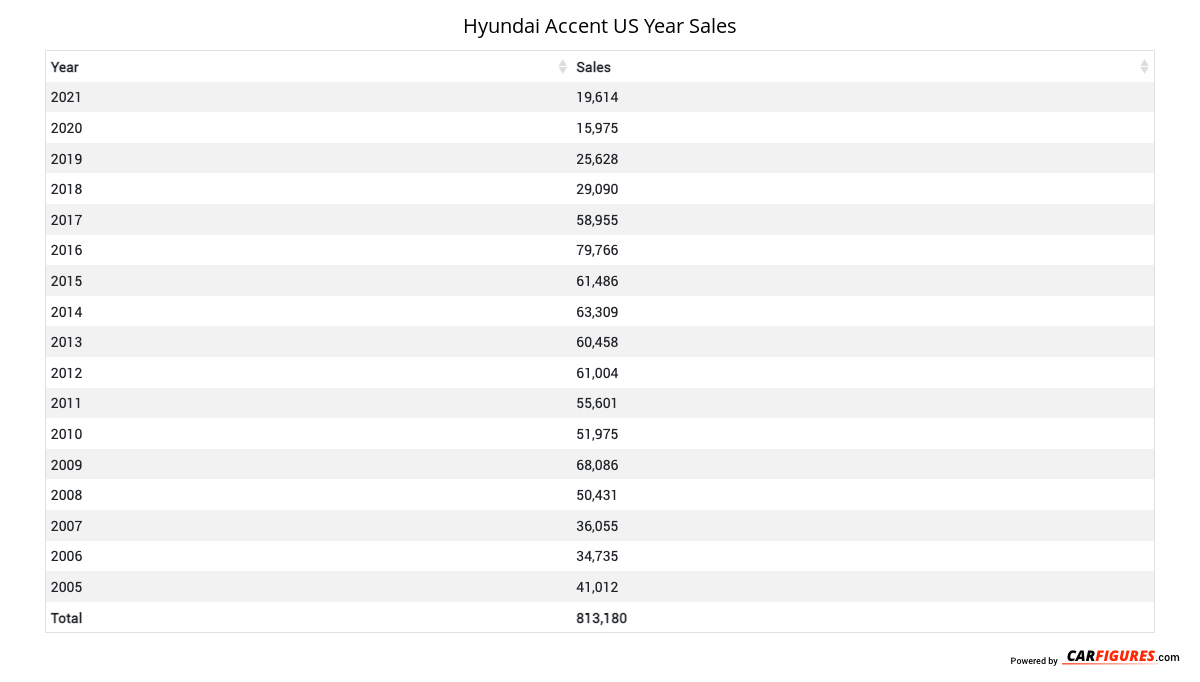
Hyundai Accent United States Sale figures by year, quarter, and month are presented below. Including the most up to date sales data for the Hyundai Accent. See how the Hyundai Accent stacks up the other models in the Cars, Subcompact Cars segments.
For sales numbers of the Hyundai Accent in Canada, click here.
Loading, please wait
Year | Jan | Feb | Mar | Apr | May | Jun | Jul | Aug | Sep | Oct | Nov | Dec |
|---|---|---|---|---|---|---|---|---|---|---|---|---|
| 2005 | 2,195 | 3,118 | 3,934 | 4,022 | 4,555 | 4,086 | 3,756 | 4,509 | 4,698 | 2,855 | 1,623 | 1,661 |
| 2006 | 1,353 | 1,231 | 2,181 | 3,491 | 3,342 | 5,848 | 4,030 | 4,705 | 1,908 | 2,010 | 1,877 | 2,759 |
| 2007 | 2,437 | 2,408 | 3,427 | 2,918 | 3,669 | 4,067 | 3,435 | 3,731 | 3,120 | 2,660 | 2,238 | 1,945 |
| 2008 | 2,941 | 3,335 | 3,938 | 4,115 | 6,941 | 6,914 | 6,740 | 6,455 | 3,014 | 2,222 | 1,983 | 1,833 |
| 2009 | 3,560 | 4,334 | 5,829 | 5,189 | 5,877 | 8,139 | 7,634 | 10,099 | 4,864 | 4,581 | 3,831 | 4,149 |
| 2010 | 5,747 | 5,308 | 4,233 | 2,990 | 4,185 | 4,615 | 3,960 | 3,844 | 4,885 | 5,372 | 4,052 | 2,784 |
| 2011 | 4,244 | 4,504 | 5,739 | 4,390 | 1,529 | 3,612 | 6,938 | 5,289 | 4,525 | 4,833 | 4,682 | 5,316 |
| 2012 | 4,341 | 5,806 | 8,337 | 6,160 | 6,166 | 5,660 | 5,257 | 5,398 | 4,313 | 3,373 | 3,260 | 2,933 |
| 2013 | 3,495 | 4,750 | 5,669 | 4,730 | 5,578 | 5,237 | 5,537 | 5,117 | 4,999 | 3,605 | 4,641 | 7,100 |
| 2014 | 4,240 | 5,925 | 5,843 | 6,419 | 6,117 | 5,720 | 3,755 | 4,724 | 3,662 | 4,839 | 3,499 | 8,566 |
| 2015 | 4,438 | 4,867 | 7,494 | 8,208 | 4,428 | 6,541 | 4,276 | 4,733 | 3,640 | 5,102 | 5,041 | 2,718 |
| 2016 | 5,050 | 4,897 | 7,879 | 12,933 | 5,432 | 3,139 | 7,046 | 8,329 | 7,495 | 6,498 | 6,909 | 4,159 |
| 2017 | 7,062 | 3,352 | 4,349 | 6,951 | 5,773 | 5,028 | 2,115 | 2,632 | 7,379 | 5,485 | 3,624 | 5,205 |
| 2018 | 2,429 | 2,080 | 2,909 | 2,816 | 2,471 | 2,120 | 1,873 | 2,586 | 2,536 | 1,483 | 1,957 | 3,830 |
| 2019 | 1,825 | 1,790 | 3,166 | 2,834 | 2,659 | 2,632 | 1,830 | 1,577 | 1,702 | 1,706 | 1,596 | 2,311 |
| 2020 | 1,565 | 2,046 | 1,196 | 736 | 1,512 | 1,239 | 1,538 | 1,135 | 1,348 | 1,129 | 972 | 1,559 |
| 2021 | 1,036 | 1,448 | 1,788 | 2,711 | 2,162 | 959 | 1,852 | 1,067 | 1,813 | 2,863 | 1,071 | 844 |
| 2022 | 507 | 744 | 1,446 | 1,372 | 1,273 | 2,088 | 3,910 | 2,174 | 1,785 | 1,683 | 687 | 154 |
| 2023 | 16 | 12 | 2 | 0 | 0 | 0 | 1 | 0 | 0 | 0 | 0 | 0 |
| 2024 | 0 | 0 | 0 | 0 | 0 | 0 | 0 | 0 | 0 | 0 | 0 | 0 |
| 2025 | - | - | - | - | - | - | - | - | - | - | - | - |
| Total | 58,481 | 61,955 | 79,359 | 82,985 | 73,669 | 77,644 | 75,483 | 78,104 | 67,686 | 62,299 | 53,543 | 59,826 |
Loading, please wait
Year | Q1 | Q2 | Q3 | Q4 |
|---|---|---|---|---|
| 2005 | 9,247 | 12,663 | 12,963 | 6,139 |
| 2006 | 4,765 | 12,681 | 10,643 | 6,646 |
| 2007 | 8,272 | 10,654 | 10,286 | 6,843 |
| 2008 | 10,214 | 17,970 | 16,209 | 6,038 |
| 2009 | 13,723 | 19,205 | 22,597 | 12,561 |
| 2010 | 15,288 | 11,790 | 12,689 | 12,208 |
| 2011 | 14,487 | 9,531 | 16,752 | 14,831 |
| 2012 | 18,484 | 17,986 | 14,968 | 9,566 |
| 2013 | 13,914 | 15,545 | 15,653 | 15,346 |
| 2014 | 16,008 | 18,256 | 12,141 | 16,904 |
| 2015 | 16,799 | 19,177 | 12,649 | 12,861 |
| 2016 | 17,826 | 21,504 | 22,870 | 17,566 |
| 2017 | 14,763 | 17,752 | 12,126 | 14,314 |
| 2018 | 7,418 | 7,407 | 6,995 | 7,270 |
| 2019 | 6,781 | 8,125 | 5,109 | 5,613 |
| 2020 | 4,807 | 3,487 | 4,021 | 3,660 |
| 2021 | 4,272 | 5,832 | 4,732 | 4,778 |
| 2022 | 2,697 | 4,733 | 7,869 | 2,524 |
| 2023 | 30 | 0 | 1 | 0 |
| 2024 | 0 | 0 | 0 | 0 |
| 2025 | - | - | - | - |
| Total | 199,795 | 234,298 | 221,273 | 175,668 |
Loading, please wait
Year | Sales |
|---|---|
| 2023 | 31 |
| 2022 | 17,823 |
| 2021 | 19,614 |
| 2020 | 15,975 |
| 2019 | 25,628 |
| 2018 | 29,090 |
| 2017 | 58,955 |
| 2016 | 79,766 |
| 2015 | 61,486 |
| 2014 | 63,309 |
| 2013 | 60,458 |
| 2012 | 61,004 |
| 2011 | 55,601 |
| 2010 | 51,975 |
| 2009 | 68,086 |
| 2008 | 50,431 |
| 2007 | 36,055 |
| 2006 | 34,735 |
| 2005 | 41,012 |
| Total | 831,034 |
Download Historic Sales Data
Embedded Code
See more widgetsSources: Manufacturers