
Key Stats
How many Canyon did GMC sell in 2024?
GMC sold 38,486 Canyon in 2024. In 2023, GMC sold 14,831 Canyon. They sold 23,655 more units in 2024 compared to 2023 with a percent gain of 159.5% YoY.
Overview
The 2022 GMC Canyon is a vehicle from automaker GMC.
How Much Does the 2022 GMC Canyon Cost?
Pricing for the 2022 GMC Canyon starts at $26,800 MSRP and goes up to $45,000 fully loaded.
GMC Canyon Engine, Transmission, and Performance Numbers
GMC Canyon is powered by a 2.5-liter engine with a Rear Wheel Drive powertrain that makes 200 -hp and 191 lb-ft torque. The transmission on the GMC Canyon is an.
List of GMC Canyon Competitors
Some of GMC Canyon competitors include the Honda Ridgeline, Chevrolet Colorado and Toyota Tacoma.
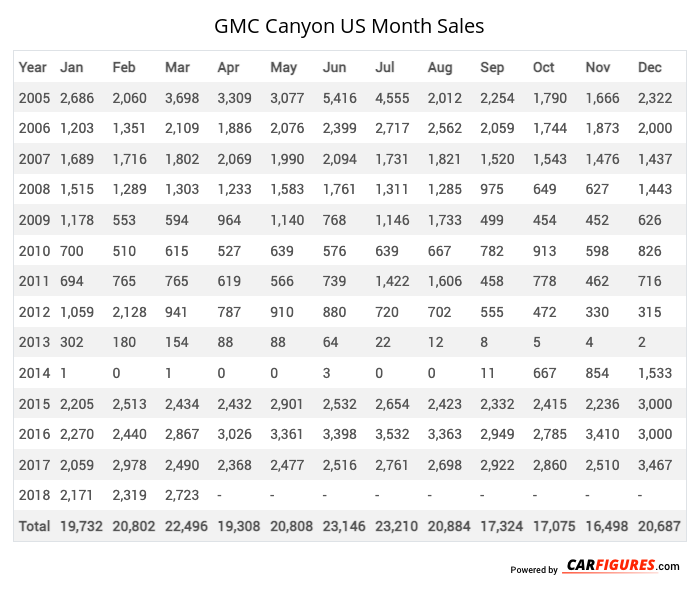
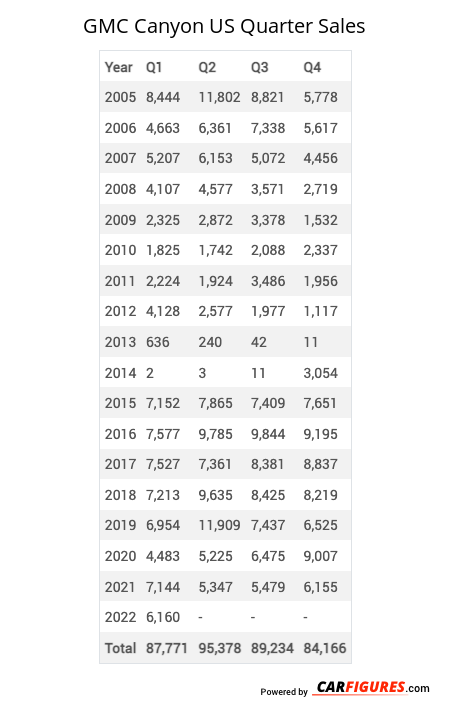
GMC Canyon United States Sale figures by year, quarter, and month are presented below. Including the most up to date sales data for the GMC Canyon. See how the GMC Canyon stacks up the other models in the Compact Pickup Trucks, Pickup Trucks segments.
Year | Jan | Feb | Mar | Apr | May | Jun | Jul | Aug | Sep | Oct | Nov | Dec |
|---|---|---|---|---|---|---|---|---|---|---|---|---|
| 2005 | 2,686 | 2,060 | 3,698 | 3,309 | 3,077 | 5,416 | 4,555 | 2,012 | 2,254 | 1,790 | 1,666 | 2,322 |
| 2006 | 1,203 | 1,351 | 2,109 | 1,886 | 2,076 | 2,399 | 2,717 | 2,562 | 2,059 | 1,744 | 1,873 | 2,000 |
| 2007 | 1,689 | 1,716 | 1,802 | 2,069 | 1,990 | 2,094 | 1,731 | 1,821 | 1,520 | 1,543 | 1,476 | 1,437 |
| 2008 | 1,515 | 1,289 | 1,303 | 1,233 | 1,583 | 1,761 | 1,311 | 1,285 | 975 | 649 | 627 | 1,443 |
| 2009 | 1,178 | 553 | 594 | 964 | 1,140 | 768 | 1,146 | 1,733 | 499 | 454 | 452 | 626 |
| 2010 | 700 | 510 | 615 | 527 | 639 | 576 | 639 | 667 | 782 | 913 | 598 | 826 |
| 2011 | 694 | 765 | 765 | 619 | 566 | 739 | 1,422 | 1,606 | 458 | 778 | 462 | 716 |
| 2012 | 1,059 | 2,128 | 941 | 787 | 910 | 880 | 720 | 702 | 555 | 472 | 330 | 315 |
| 2013 | 302 | 180 | 154 | 88 | 88 | 64 | 22 | 12 | 8 | 5 | 4 | 2 |
| 2014 | 1 | 0 | 1 | 0 | 0 | 3 | 0 | 0 | 11 | 667 | 854 | 1,533 |
| 2015 | 2,205 | 2,513 | 2,434 | 2,432 | 2,901 | 2,532 | 2,654 | 2,423 | 2,332 | 2,415 | 2,236 | 3,000 |
| 2016 | 2,270 | 2,440 | 2,867 | 3,026 | 3,361 | 3,398 | 3,532 | 3,363 | 2,949 | 2,785 | 3,410 | 3,000 |
| 2017 | 2,059 | 2,978 | 2,490 | 2,368 | 2,477 | 2,516 | 2,761 | 2,698 | 2,922 | 2,860 | 2,510 | 3,467 |
| 2018 | 2,171 | 2,319 | 2,723 | - | - | - | - | - | - | - | - | - |
| Total | 19,732 | 20,802 | 22,496 | 19,308 | 20,808 | 23,146 | 23,210 | 20,884 | 17,324 | 17,075 | 16,498 | 20,687 |
Year | Q1 | Q2 | Q3 | Q4 |
|---|---|---|---|---|
| 2005 | 8,444 | 11,802 | 8,821 | 5,778 |
| 2006 | 4,663 | 6,361 | 7,338 | 5,617 |
| 2007 | 5,207 | 6,153 | 5,072 | 4,456 |
| 2008 | 4,107 | 4,577 | 3,571 | 2,719 |
| 2009 | 2,325 | 2,872 | 3,378 | 1,532 |
| 2010 | 1,825 | 1,742 | 2,088 | 2,337 |
| 2011 | 2,224 | 1,924 | 3,486 | 1,956 |
| 2012 | 4,128 | 2,577 | 1,977 | 1,117 |
| 2013 | 636 | 240 | 42 | 11 |
| 2014 | 2 | 3 | 11 | 3,054 |
| 2015 | 7,152 | 7,865 | 7,409 | 7,651 |
| 2016 | 7,577 | 9,785 | 9,844 | 9,195 |
| 2017 | 7,527 | 7,361 | 8,381 | 8,837 |
| 2018 | 7,213 | 9,635 | 8,425 | 8,219 |
| 2019 | 6,954 | 11,909 | 7,437 | 6,525 |
| 2020 | 4,483 | 5,225 | 6,475 | 9,007 |
| 2021 | 7,144 | 5,347 | 5,479 | 6,155 |
| 2022 | 6,160 | 7,502 | 7,751 | 6,408 |
| 2023 | 5,016 | 6,708 | 0 | 3,107 |
| 2024 | 5,484 | 11,351 | 10,121 | 11,530 |
| 2025 | - | - | - | - |
| Total | 98,271 | 120,939 | 107,106 | 105,211 |
Year | Sales |
|---|---|
| 2024 | 38,486 |
| 2023 | 14,831 |
| 2022 | 27,821 |
| 2021 | 24,125 |
| 2020 | 25,190 |
| 2019 | 32,825 |
| 2018 | 33,492 |
| 2017 | 32,106 |
| 2016 | 36,401 |
| 2015 | 30,077 |
| 2014 | 3,070 |
| 2013 | 929 |
| 2012 | 9,799 |
| 2011 | 9,590 |
| 2010 | 7,992 |
| 2009 | 10,107 |
| 2008 | 14,974 |
| 2007 | 20,888 |
| 2006 | 23,979 |
| 2005 | 34,845 |
| Total | 431,527 |
Download Historic Sales Data

Embedded Code
See more widgetsSources: Manufacturers