Overview
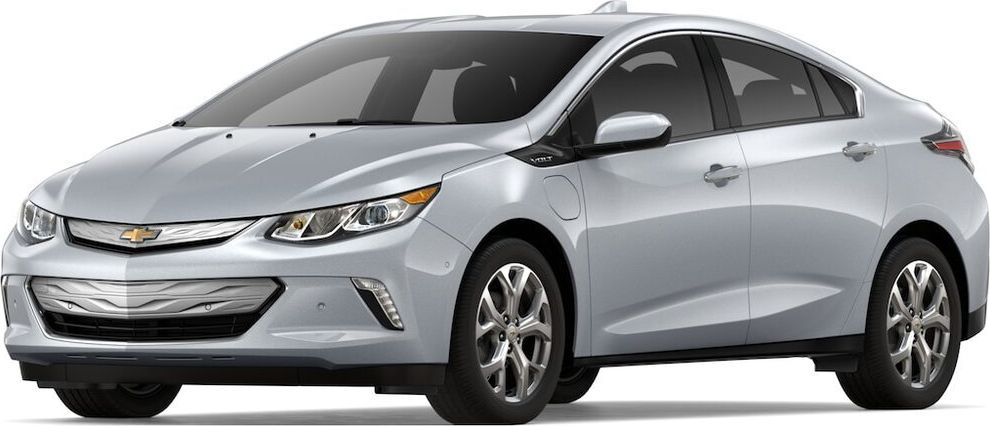
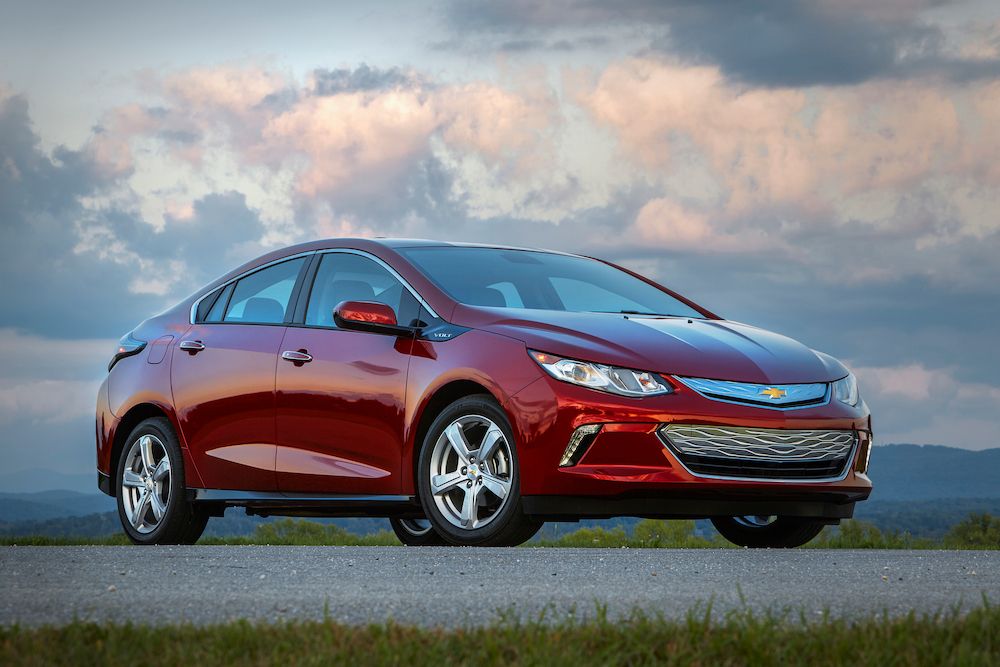
The Chevrolet Volt is a Hatchback with room for 5 people from automaker Chevrolet.
How Much Does the 2019 Chevrolet Volt Cost?
Pricing for the 2019 Chevrolet Volt starts at $12,855 MSRP and goes up to $56,575 fully loaded.
Chevrolet Volt Engine, Transmission, and Performance Numbers
Chevrolet Volt includes a 1.5-liter I-4 engine combined with a 1-speed automatic. This delivers 101 hp with 103 lbs.-ft. Torque delivered through a FWD drivetrain.
2019 Chevrolet Volt Specifications
The has a curb weight of 3,519 lbs.
Chevrolet Volt United States Sale figures by year, quarter, and month are presented below. Including the most up to date sales data for the Chevrolet Volt. See how the Chevrolet Volt stacks up the other models in the Cars, Compact Cars segments.
For sales numbers of the Chevrolet Volt in Canada, click here.
Loading, please wait
Year | Jan | Feb | Mar | Apr | May | Jun | Jul | Aug | Sep | Oct | Nov | Dec |
|---|---|---|---|---|---|---|---|---|---|---|---|---|
| 2011 | 321 | 281 | 608 | 493 | 481 | 561 | 125 | 302 | 723 | 1,108 | 1,139 | 1,529 |
| 2012 | 603 | 2,046 | 2,289 | 1,462 | 1,680 | 1,760 | 1,849 | 2,831 | 2,851 | 2,961 | 1,519 | 2,533 |
| 2013 | 1,140 | 1,626 | 1,478 | 1,306 | 1,607 | 2,698 | 1,788 | 3,351 | 1,766 | 2,022 | 1,920 | 2,392 |
| 2014 | 918 | 1,210 | 1,478 | 1,548 | 1,684 | 1,777 | 2,020 | 2,511 | 1,394 | 1,439 | 1,336 | 1,490 |
| 2015 | 542 | 693 | 639 | 905 | 1,618 | 1,225 | 1,313 | 1,380 | 949 | 2,035 | 1,980 | 2,114 |
| 2016 | 996 | 1,126 | 1,865 | 1,983 | 1,901 | 1,937 | 2,406 | 2,081 | 2,031 | 2,191 | 2,531 | 3,691 |
| 2017 | 1,611 | 1,820 | 2,132 | 1,807 | 1,817 | 1,745 | 1,518 | 1,445 | 1,453 | 1,362 | 1,702 | 1,937 |
| 2018 | 713 | 983 | 1,782 | - | - | - | - | - | - | - | - | - |
| Total | 6,844 | 9,785 | 12,271 | 9,504 | 10,788 | 11,703 | 11,019 | 13,901 | 11,167 | 13,118 | 12,127 | 15,686 |
Loading, please wait
Year | Q1 | Q2 | Q3 | Q4 |
|---|---|---|---|---|
| 2011 | 1,210 | 1,535 | 1,150 | 3,776 |
| 2012 | 4,938 | 4,902 | 7,531 | 7,013 |
| 2013 | 4,244 | 5,611 | 6,905 | 6,334 |
| 2014 | 3,606 | 5,009 | 5,925 | 4,265 |
| 2015 | 1,874 | 3,748 | 3,642 | 6,129 |
| 2016 | 3,987 | 5,821 | 6,518 | 8,413 |
| 2017 | 5,563 | 5,369 | 4,416 | 5,001 |
| 2018 | 3,478 | 4,336 | 5,429 | 5,063 |
| 2019 | 2,520 | 1,146 | 874 | 370 |
| 2020 | 23 | 39 | 5 | 4 |
| 2021 | 1 | 1 | 0 | 0 |
| 2022 | 0 | 0 | 0 | 0 |
| 2023 | 0 | 0 | 0 | 0 |
| 2024 | - | - | - | - |
| Total | 31,444 | 37,517 | 42,395 | 46,368 |
Loading, please wait
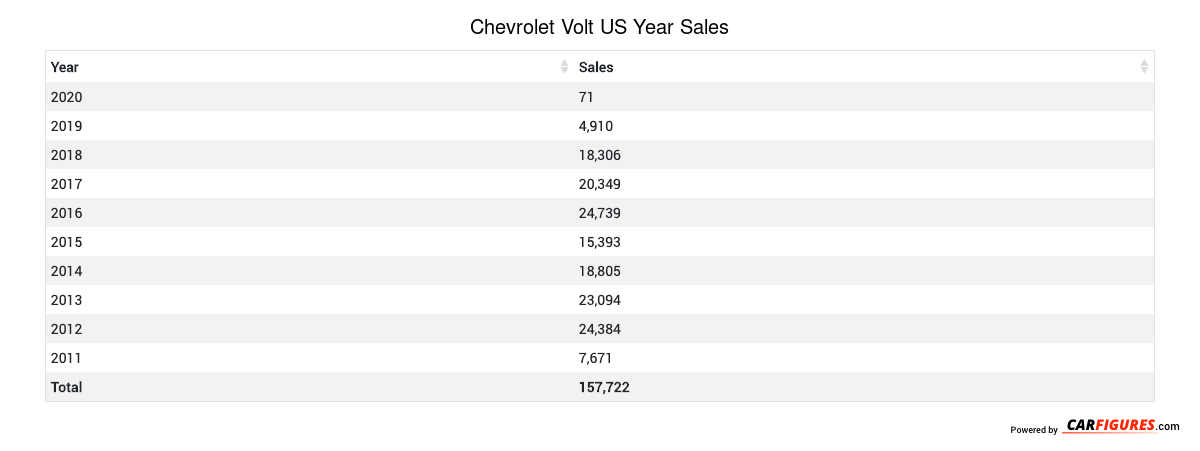
Year | Sales |
|---|---|
| 2021 | 2 |
| 2020 | 71 |
| 2019 | 4,910 |
| 2018 | 18,306 |
| 2017 | 20,349 |
| 2016 | 24,739 |
| 2015 | 15,393 |
| 2014 | 18,805 |
| 2013 | 23,094 |
| 2012 | 24,384 |
| 2011 | 7,671 |
| Total | 157,724 |
Download Historic Sales Data


Embedded Code
See more widgetsSources: Manufacturers