
Key Stats
How many Trax did Chevrolet sell in 2024?
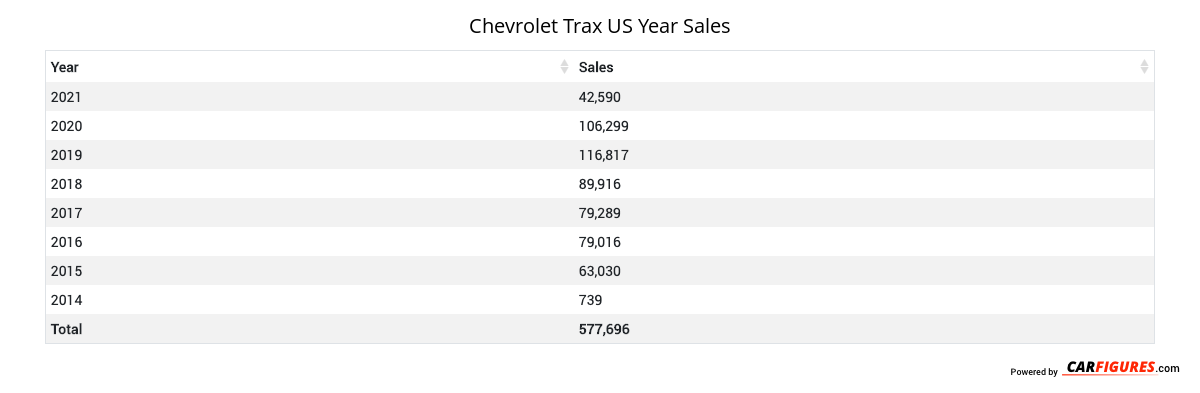
Chevrolet sold 200,688 Trax in 2024. In 2023, Chevrolet sold 71,513 Trax. They sold 129,175 more units in 2024 compared to 2023 with a percent gain of 180.63% YoY.
Overview
The 2024 Chevrolet Trax is a vehicle from automaker Chevrolet.
How Much Does the 2024 Chevrolet Trax Cost?
The 2024 Chevrolet Trax starts at $20,400 MSRP. Fully loaded, the Chevrolet Trax will cost you about $23,900.
Chevrolet Trax Engine, Transmission, and Performance Numbers
Chevrolet Trax includes a 1.2-liter engine combined with a. This delivers 137 hp with 162 lb-ft torque delivered through a Front Wheel Drive drivetrain.
List of Chevrolet Trax Competitors
Some of Chevrolet Trax competitors include the Buick Encore, Chevrolet Equinox and Ford EcoSport.
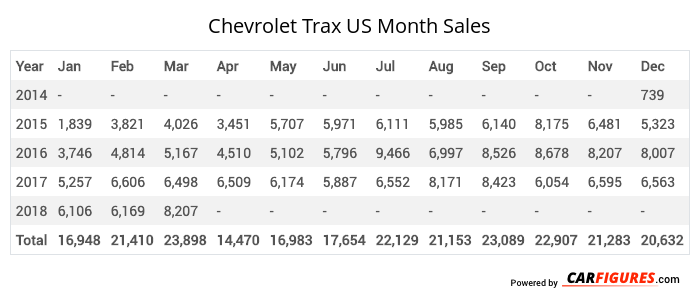
Chevrolet Trax United States Sale figures by year, quarter, and month are presented below. Including the most up to date sales data for the Chevrolet Trax. See how the Chevrolet Trax stacks up the other models in the Crossover/SUVS, Subcompact Crossover/SUVs segments.
Year | Jan | Feb | Mar | Apr | May | Jun | Jul | Aug | Sep | Oct | Nov | Dec |
|---|---|---|---|---|---|---|---|---|---|---|---|---|
| 2014 | - | - | - | - | - | - | - | - | - | - | - | 739 |
| 2015 | 1,839 | 3,821 | 4,026 | 3,451 | 5,707 | 5,971 | 6,111 | 5,985 | 6,140 | 8,175 | 6,481 | 5,323 |
| 2016 | 3,746 | 4,814 | 5,167 | 4,510 | 5,102 | 5,796 | 9,466 | 6,997 | 8,526 | 8,678 | 8,207 | 8,007 |
| 2017 | 5,257 | 6,606 | 6,498 | 6,509 | 6,174 | 5,887 | 6,552 | 8,171 | 8,423 | 6,054 | 6,595 | 6,563 |
| 2018 | 6,106 | 6,169 | 8,207 | - | - | - | - | - | - | - | - | - |
| Total | 16,948 | 21,410 | 23,898 | 14,470 | 16,983 | 17,654 | 22,129 | 21,153 | 23,089 | 22,907 | 21,283 | 20,632 |
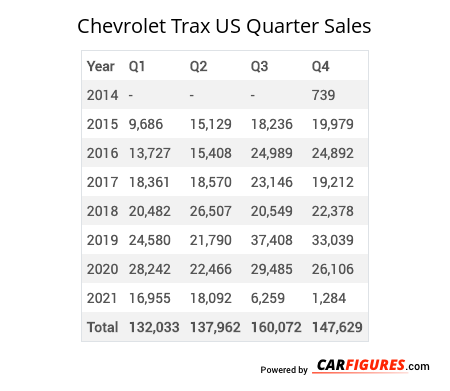
Year | Q1 | Q2 | Q3 | Q4 |
|---|---|---|---|---|
| 2014 | - | - | - | 739 |
| 2015 | 9,686 | 15,129 | 18,236 | 19,979 |
| 2016 | 13,727 | 15,408 | 24,989 | 24,892 |
| 2017 | 18,361 | 18,570 | 23,146 | 19,212 |
| 2018 | 20,482 | 26,507 | 20,549 | 22,378 |
| 2019 | 24,580 | 21,790 | 37,408 | 33,039 |
| 2020 | 28,242 | 22,466 | 29,485 | 26,106 |
| 2021 | 16,955 | 18,092 | 6,259 | 1,284 |
| 2022 | 5,800 | 9,753 | 6,329 | 4,716 |
| 2023 | 6,466 | 20,921 | 0 | 44,126 |
| 2024 | 37,587 | 52,875 | 59,299 | 50,927 |
| 2025 | - | - | - | - |
| Total | 181,886 | 221,511 | 225,700 | 247,398 |
Year | Sales |
|---|---|
| 2024 | 200,688 |
| 2023 | 71,513 |
| 2022 | 26,598 |
| 2021 | 42,590 |
| 2020 | 106,299 |
| 2019 | 116,817 |
| 2018 | 89,916 |
| 2017 | 79,289 |
| 2016 | 79,016 |
| 2015 | 63,030 |
| 2014 | 739 |
| Total | 876,495 |
Download Historic Sales Data
Embedded Code
See more widgetsSources: Manufacturers