

Overview
The BMW 640 Gran Coupe is a Sedan with room for 5 people from automaker BMW.
How Much Does the 2019 BMW 640 Gran Coupe Cost?
Pricing for the 2019 BMW 640 Gran Coupe starts at $42,049 MSRP and goes up to $62,025 fully loaded.
BMW 640 Gran Coupe Engine, Transmission, and Performance Numbers
The BMW 640 Gran Coupe includes a 3.0-liter I-6 coupled with a that delivers 315 hp and torque with a RWD drivetrain.
2019 BMW 640 Gran Coupe Fuel Economy
The 2019 BMW 640 Gran Coupe is expected to get 23 mpg combined.
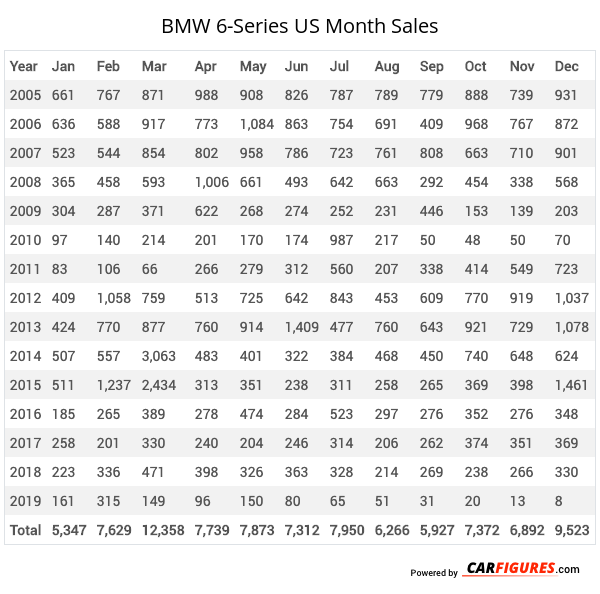
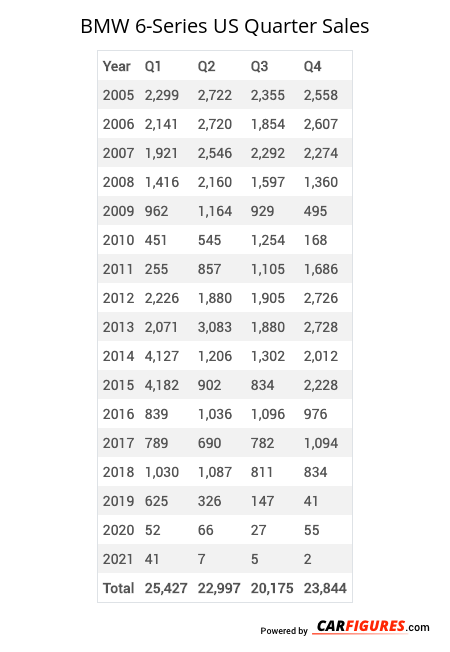
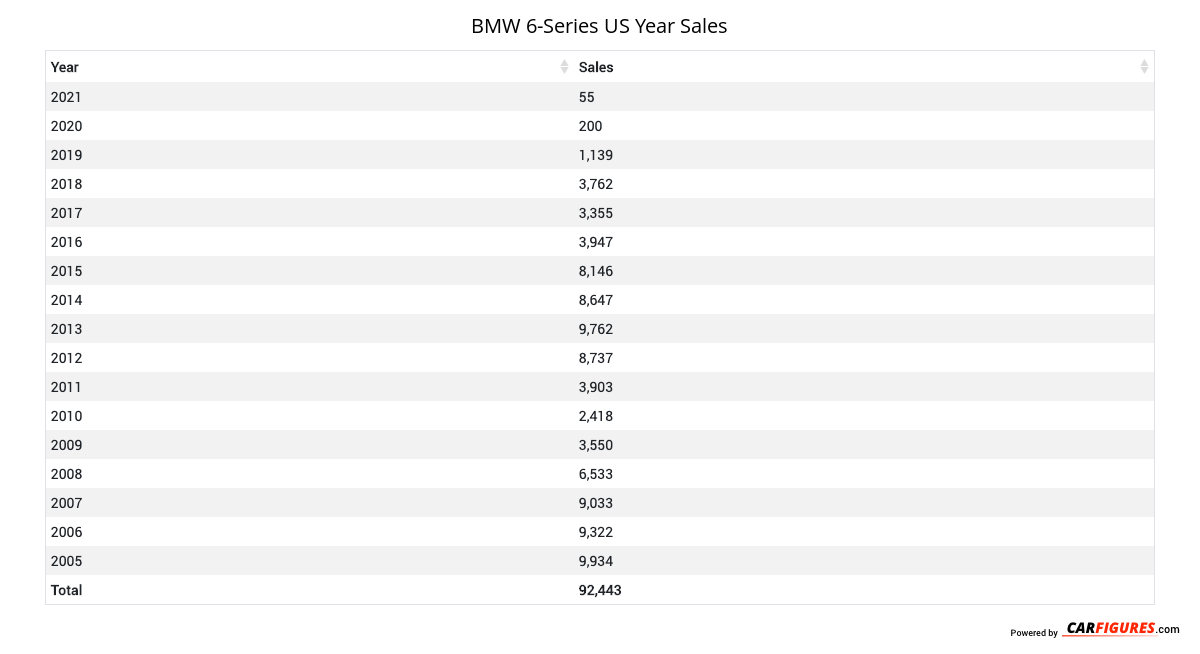
BMW 6-Series United States Sale figures by year, quarter, and month are presented below. Including the most up to date sales data for the BMW 6-Series. See how the BMW 6-Series stacks up the other models in the Cars, Premium Midsize Cars segments.
For sales numbers of the BMW 6-Series in Canada, click here.
Loading, please wait
Year | Jan | Feb | Mar | Apr | May | Jun | Jul | Aug | Sep | Oct | Nov | Dec |
|---|---|---|---|---|---|---|---|---|---|---|---|---|
| 2005 | 661 | 767 | 871 | 988 | 908 | 826 | 787 | 789 | 779 | 888 | 739 | 931 |
| 2006 | 636 | 588 | 917 | 773 | 1,084 | 863 | 754 | 691 | 409 | 968 | 767 | 872 |
| 2007 | 523 | 544 | 854 | 802 | 958 | 786 | 723 | 761 | 808 | 663 | 710 | 901 |
| 2008 | 365 | 458 | 593 | 1,006 | 661 | 493 | 642 | 663 | 292 | 454 | 338 | 568 |
| 2009 | 304 | 287 | 371 | 622 | 268 | 274 | 252 | 231 | 446 | 153 | 139 | 203 |
| 2010 | 97 | 140 | 214 | 201 | 170 | 174 | 987 | 217 | 50 | 48 | 50 | 70 |
| 2011 | 83 | 106 | 66 | 266 | 279 | 312 | 560 | 207 | 338 | 414 | 549 | 723 |
| 2012 | 409 | 1,058 | 759 | 513 | 725 | 642 | 843 | 453 | 609 | 770 | 919 | 1,037 |
| 2013 | 424 | 770 | 877 | 760 | 914 | 1,409 | 477 | 760 | 643 | 921 | 729 | 1,078 |
| 2014 | 507 | 557 | 3,063 | 483 | 401 | 322 | 384 | 468 | 450 | 740 | 648 | 624 |
| 2015 | 511 | 1,237 | 2,434 | 313 | 351 | 238 | 311 | 258 | 265 | 369 | 398 | 1,461 |
| 2016 | 185 | 265 | 389 | 278 | 474 | 284 | 523 | 297 | 276 | 352 | 276 | 348 |
| 2017 | 258 | 201 | 330 | 240 | 204 | 246 | 314 | 206 | 262 | 374 | 351 | 369 |
| 2018 | 223 | 336 | 471 | 398 | 326 | 363 | 328 | 214 | 269 | 238 | 266 | 330 |
| 2019 | 161 | 315 | 149 | 96 | 150 | 80 | 65 | 51 | 31 | 20 | 13 | 8 |
| Total | 5,347 | 7,629 | 12,358 | 7,739 | 7,873 | 7,312 | 7,950 | 6,266 | 5,927 | 7,372 | 6,892 | 9,523 |
Loading, please wait
Year | Q1 | Q2 | Q3 | Q4 |
|---|---|---|---|---|
| 2005 | 2,299 | 2,722 | 2,355 | 2,558 |
| 2006 | 2,141 | 2,720 | 1,854 | 2,607 |
| 2007 | 1,921 | 2,546 | 2,292 | 2,274 |
| 2008 | 1,416 | 2,160 | 1,597 | 1,360 |
| 2009 | 962 | 1,164 | 929 | 495 |
| 2010 | 451 | 545 | 1,254 | 168 |
| 2011 | 255 | 857 | 1,105 | 1,686 |
| 2012 | 2,226 | 1,880 | 1,905 | 2,726 |
| 2013 | 2,071 | 3,083 | 1,880 | 2,728 |
| 2014 | 4,127 | 1,206 | 1,302 | 2,012 |
| 2015 | 4,182 | 902 | 834 | 2,228 |
| 2016 | 839 | 1,036 | 1,096 | 976 |
| 2017 | 789 | 690 | 782 | 1,094 |
| 2018 | 1,030 | 1,087 | 811 | 834 |
| 2019 | 625 | 326 | 147 | 41 |
| 2020 | 52 | 66 | 27 | 55 |
| 2021 | 41 | 7 | 5 | 2 |
| 2022 | 0 | 0 | 0 | 0 |
| 2023 | 0 | 0 | 0 | 0 |
| 2024 | 0 | 0 | 0 | 0 |
| 2025 | - | - | - | - |
| Total | 25,427 | 22,997 | 20,175 | 23,844 |
Loading, please wait
Year | Sales |
|---|---|
| 2021 | 55 |
| 2020 | 200 |
| 2019 | 1,139 |
| 2018 | 3,762 |
| 2017 | 3,355 |
| 2016 | 3,947 |
| 2015 | 8,146 |
| 2014 | 8,647 |
| 2013 | 9,762 |
| 2012 | 8,737 |
| 2011 | 3,903 |
| 2010 | 2,418 |
| 2009 | 3,550 |
| 2008 | 6,533 |
| 2007 | 9,033 |
| 2006 | 9,322 |
| 2005 | 9,934 |
| Total | 92,443 |
Download Historic Sales Data
Embedded Code
See more widgetsSources: Manufacturers