Key Stats
How many A6/S6 did Audi sell in 2024?
Audi sold 6,448 A6/S6 in 2024. In 2023, Audi sold 5,939 A6/S6. They sold 509 more units in 2024 compared to 2023 with a percent gain of 8.57% YoY.
Overview
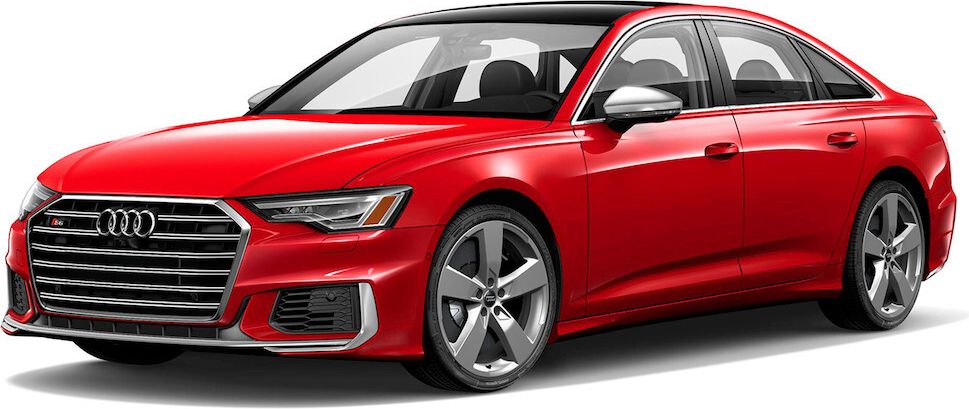
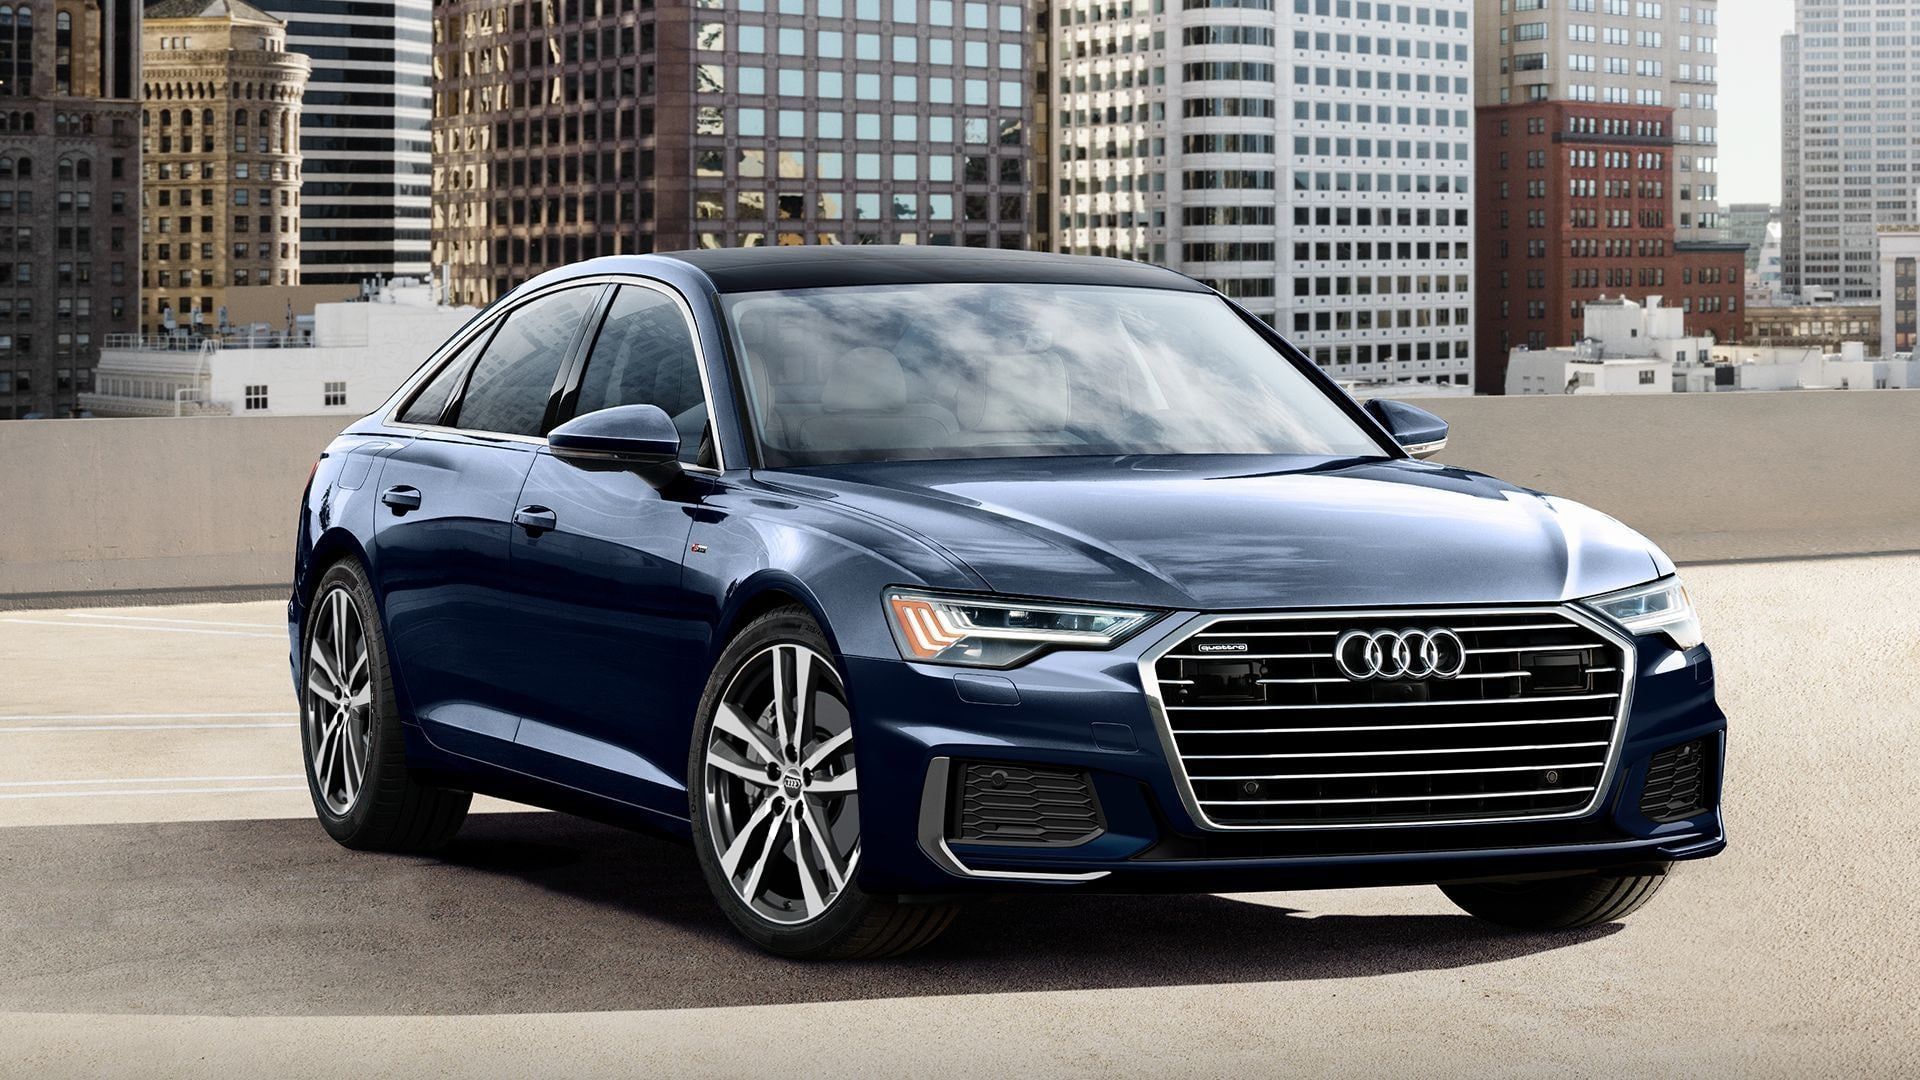
The 2022 Audi A6 is a vehicle from automaker Audi.
How Much Does the 2022 Audi A6 Cost?
Pricing for the 2022 Audi A6 starts at $55,900 MSRP and goes up to $59,800 fully loaded.
Audi A6 Engine, Transmission, and Performance Numbers
Audi A6 includes a 2.0-liter engine combined with a 7-Speed Stronic. This delivers 261 hp with 273 lb-ft torque delivered through a All Wheel Drive drivetrain.
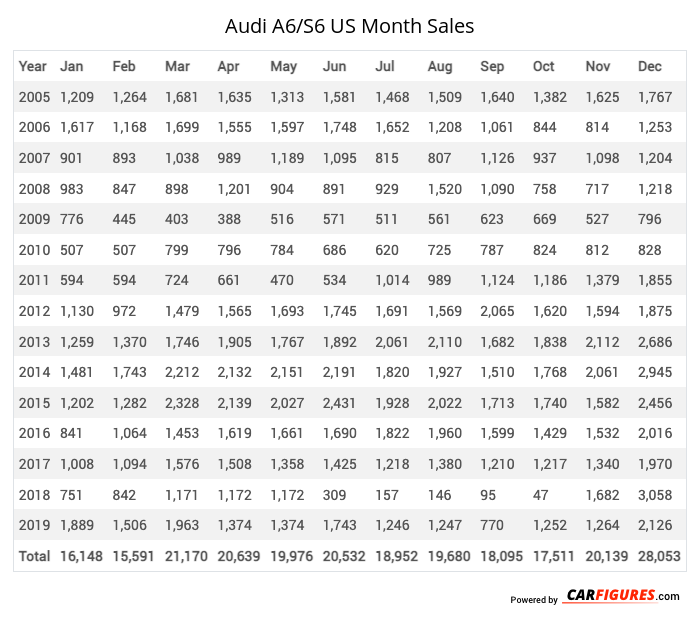
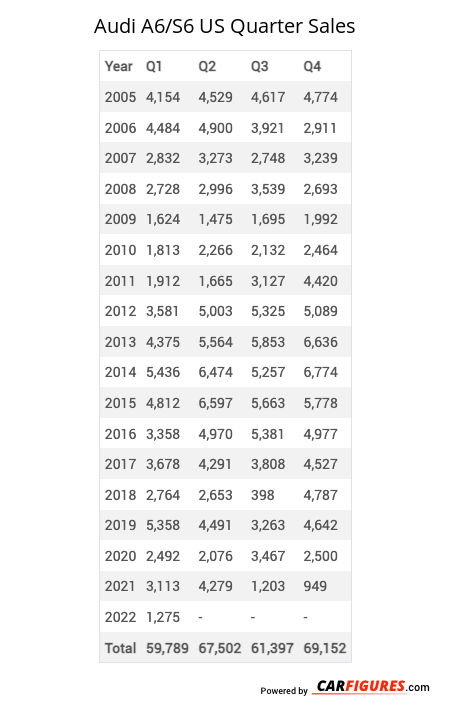
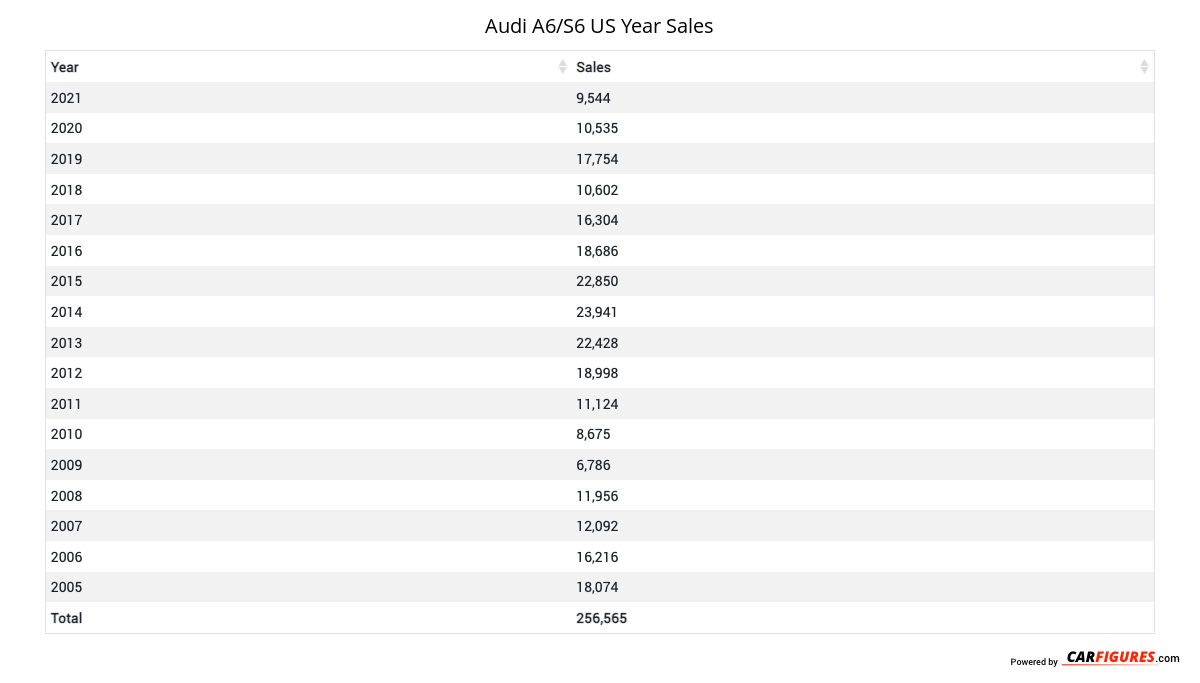
Audi A6/S6 United States Sale figures by year, quarter, and month are presented below. Including the most up to date sales data for the Audi A6/S6. See how the Audi A6/S6 stacks up the other models in the Cars, Premium Midsize Cars segments.
*Sales report includes A6 Sedan, S6 Sedan
Year | Jan | Feb | Mar | Apr | May | Jun | Jul | Aug | Sep | Oct | Nov | Dec |
|---|---|---|---|---|---|---|---|---|---|---|---|---|
| 2005 | 1,209 | 1,264 | 1,681 | 1,635 | 1,313 | 1,581 | 1,468 | 1,509 | 1,640 | 1,382 | 1,625 | 1,767 |
| 2006 | 1,617 | 1,168 | 1,699 | 1,555 | 1,597 | 1,748 | 1,652 | 1,208 | 1,061 | 844 | 814 | 1,253 |
| 2007 | 901 | 893 | 1,038 | 989 | 1,189 | 1,095 | 815 | 807 | 1,126 | 937 | 1,098 | 1,204 |
| 2008 | 983 | 847 | 898 | 1,201 | 904 | 891 | 929 | 1,520 | 1,090 | 758 | 717 | 1,218 |
| 2009 | 776 | 445 | 403 | 388 | 516 | 571 | 511 | 561 | 623 | 669 | 527 | 796 |
| 2010 | 507 | 507 | 799 | 796 | 784 | 686 | 620 | 725 | 787 | 824 | 812 | 828 |
| 2011 | 594 | 594 | 724 | 661 | 470 | 534 | 1,014 | 989 | 1,124 | 1,186 | 1,379 | 1,855 |
| 2012 | 1,130 | 972 | 1,479 | 1,565 | 1,693 | 1,745 | 1,691 | 1,569 | 2,065 | 1,620 | 1,594 | 1,875 |
| 2013 | 1,259 | 1,370 | 1,746 | 1,905 | 1,767 | 1,892 | 2,061 | 2,110 | 1,682 | 1,838 | 2,112 | 2,686 |
| 2014 | 1,481 | 1,743 | 2,212 | 2,132 | 2,151 | 2,191 | 1,820 | 1,927 | 1,510 | 1,768 | 2,061 | 2,945 |
| 2015 | 1,202 | 1,282 | 2,328 | 2,139 | 2,027 | 2,431 | 1,928 | 2,022 | 1,713 | 1,740 | 1,582 | 2,456 |
| 2016 | 841 | 1,064 | 1,453 | 1,619 | 1,661 | 1,690 | 1,822 | 1,960 | 1,599 | 1,429 | 1,532 | 2,016 |
| 2017 | 1,008 | 1,094 | 1,576 | 1,508 | 1,358 | 1,425 | 1,218 | 1,380 | 1,210 | 1,217 | 1,340 | 1,970 |
| 2018 | 751 | 842 | 1,171 | 1,172 | 1,172 | 309 | 157 | 146 | 95 | 47 | 1,682 | 3,058 |
| 2019 | 1,889 | 1,506 | 1,963 | 1,374 | 1,374 | 1,743 | 1,246 | 1,247 | 770 | 1,252 | 1,264 | 2,126 |
| Total | 16,148 | 15,591 | 21,170 | 20,639 | 19,976 | 20,532 | 18,952 | 19,680 | 18,095 | 17,511 | 20,139 | 28,053 |
Year | Q1 | Q2 | Q3 | Q4 |
|---|---|---|---|---|
| 2005 | 4,154 | 4,529 | 4,617 | 4,774 |
| 2006 | 4,484 | 4,900 | 3,921 | 2,911 |
| 2007 | 2,832 | 3,273 | 2,748 | 3,239 |
| 2008 | 2,728 | 2,996 | 3,539 | 2,693 |
| 2009 | 1,624 | 1,475 | 1,695 | 1,992 |
| 2010 | 1,813 | 2,266 | 2,132 | 2,464 |
| 2011 | 1,912 | 1,665 | 3,127 | 4,420 |
| 2012 | 3,581 | 5,003 | 5,325 | 5,089 |
| 2013 | 4,375 | 5,564 | 5,853 | 6,636 |
| 2014 | 5,436 | 6,474 | 5,257 | 6,774 |
| 2015 | 4,812 | 6,597 | 5,663 | 5,778 |
| 2016 | 3,358 | 4,970 | 5,381 | 4,977 |
| 2017 | 3,678 | 4,291 | 3,808 | 4,527 |
| 2018 | 2,764 | 2,653 | 398 | 4,787 |
| 2019 | 5,358 | 4,491 | 3,263 | 4,642 |
| 2020 | 2,492 | 2,076 | 3,467 | 2,500 |
| 2021 | 3,113 | 4,279 | 1,203 | 949 |
| 2022 | 1,275 | 1,449 | 1,559 | 1,722 |
| 2023 | 1,985 | 1,534 | 0 | 2,420 |
| 2024 | 2,016 | 2,215 | 2,217 | 0 |
| 2025 | - | - | - | - |
| Total | 63,790 | 72,700 | 65,173 | 73,294 |
Year | Sales |
|---|---|
| 2024 | 6,448 |
| 2023 | 5,939 |
| 2022 | 6,005 |
| 2021 | 9,544 |
| 2020 | 10,535 |
| 2019 | 17,754 |
| 2018 | 10,602 |
| 2017 | 16,304 |
| 2016 | 18,686 |
| 2015 | 22,850 |
| 2014 | 23,941 |
| 2013 | 22,428 |
| 2012 | 18,998 |
| 2011 | 11,124 |
| 2010 | 8,675 |
| 2009 | 6,786 |
| 2008 | 11,956 |
| 2007 | 12,092 |
| 2006 | 16,216 |
| 2005 | 18,074 |
| Total | 274,957 |
Download Historic Sales Data
Embedded Code
See more widgetsSources: Manufacturers