Key Stats
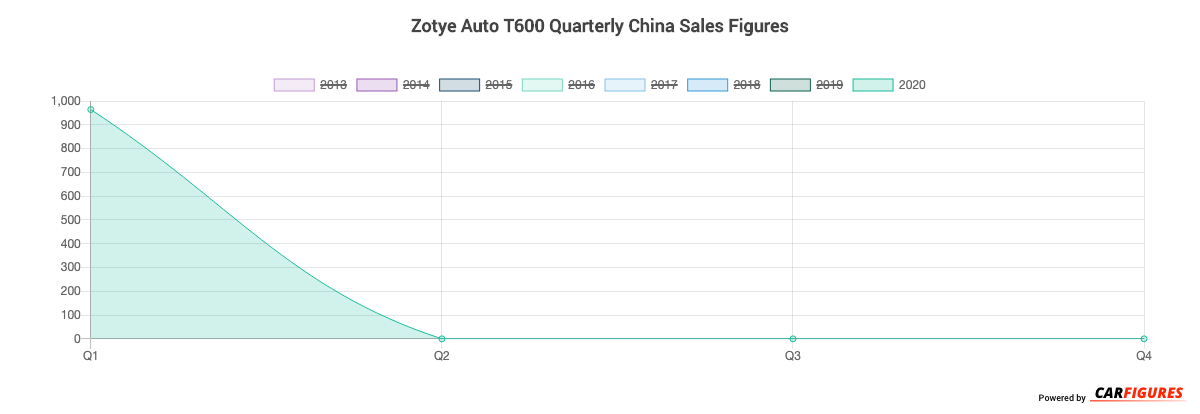
How many T600 did Zotye Auto sell in 2020?
Zotye Auto sold 964 T600 in 2020. (From Jan - Dec 2020)
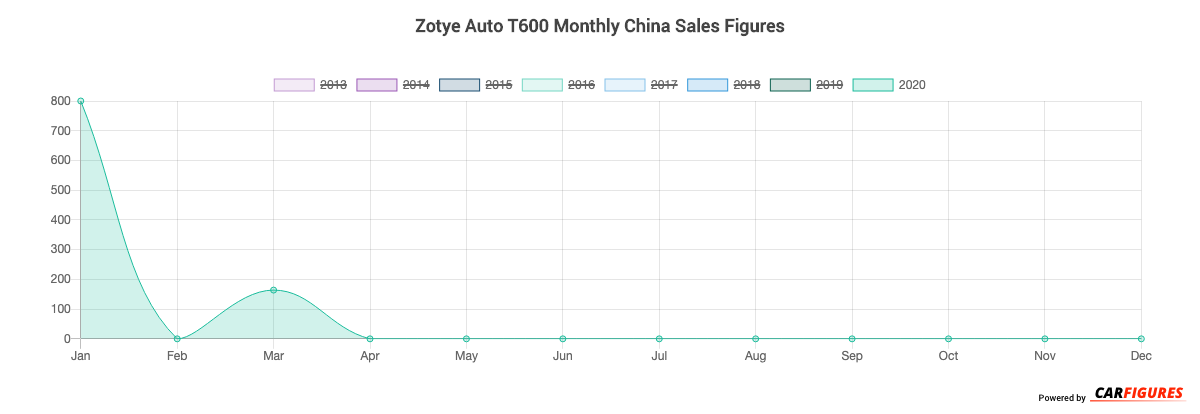
How many T600 did Zotye Auto sell in March 2020?
Zotye Auto sold 164 T600 in March 2020.
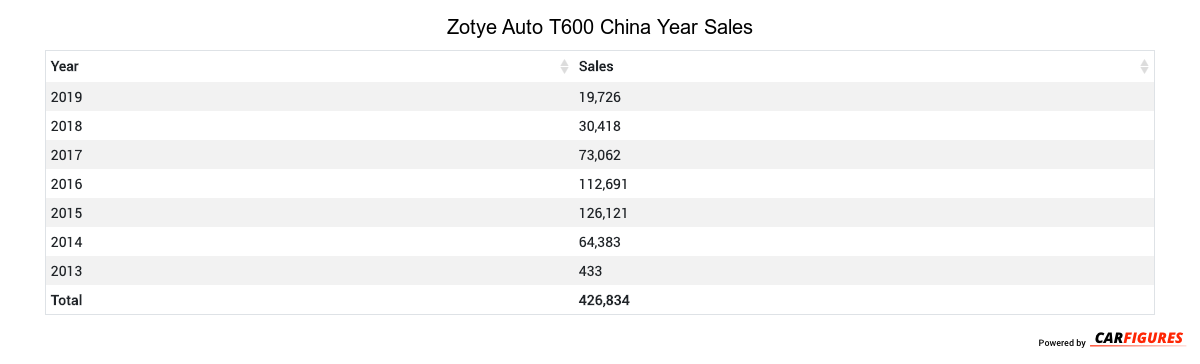
How many T600 did Zotye Auto sell in 2019?
Zotye Auto sold 19,726 T600 in 2019. In 2018, Zotye Auto sold 30,418 T600. They sold 10,692 more units in year 2018 compared to 2019 with a percent loss of 35.15% YoY.
Overview
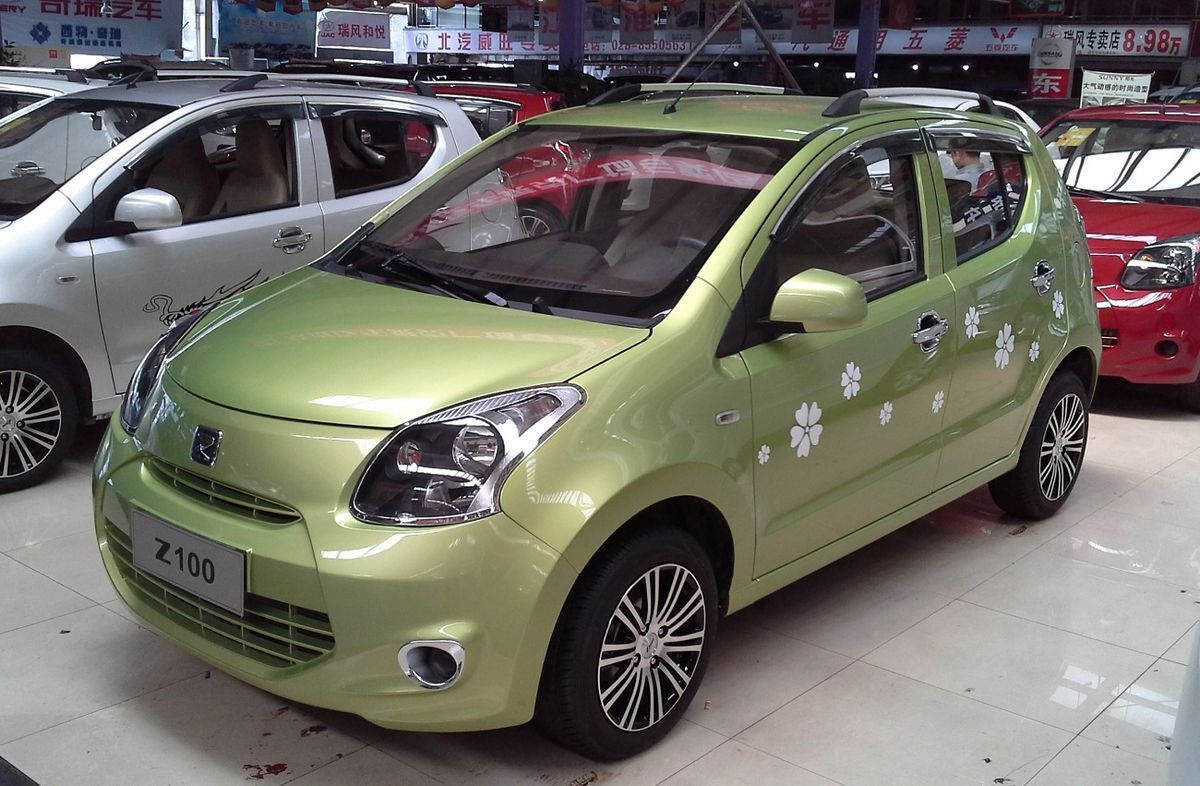
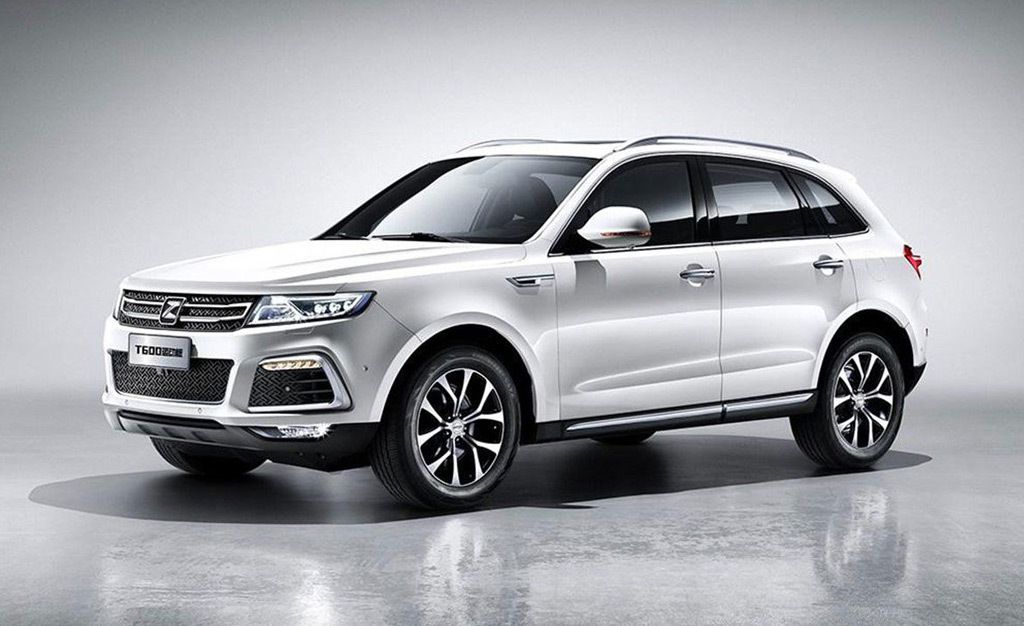
The T600 is a 5 doors 5 seats SUV with room for 5 people from automaker Zotye Auto.
How Much Does the Zotye Auto T600 Cost?
Pricing for the T600 starts at CN¥79,800 Yuan ($11,172 USD) MSRP and goes up to CN¥142,800 Yuan ($19,992 USD) fully equipped.
Zotye Auto T600 Engine and Performance
The T600 includes a 1.5TL that delivers 105 Kw (140.81 HP) - 140 Kw (187.74 HP) and 207 Nm (153.18 ft-lb) - 250 Nm (185.00 ft-lb) torque.
Zotye Auto T600 Specifications
The T600 has a curb weight of 1,500 kg (3,400 lbs) - 1,700 kg (3,700 lbs).
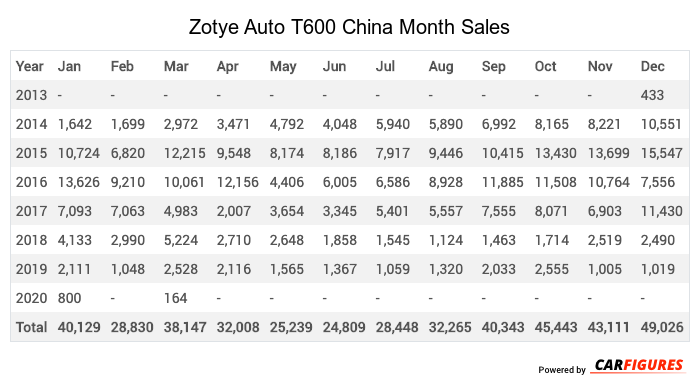
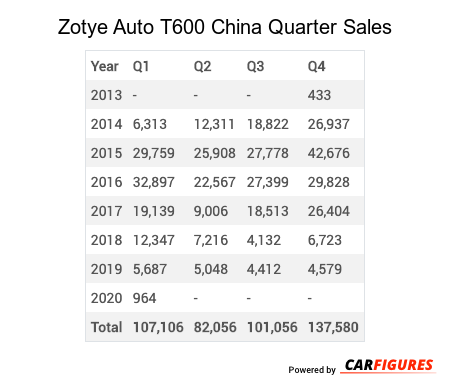
Zotye Auto T600 China Sale figures by year, quarter, and month are presented below. Including the most up to date sales data for the Zotye Auto T600.
Year | Jan | Feb | Mar | Apr | May | Jun | Jul | Aug | Sep | Oct | Nov | Dec |
|---|---|---|---|---|---|---|---|---|---|---|---|---|
| 2013 | - | - | - | - | - | - | - | - | - | - | - | 433 |
| 2014 | 1,642 | 1,699 | 2,972 | 3,471 | 4,792 | 4,048 | 5,940 | 5,890 | 6,992 | 8,165 | 8,221 | 10,551 |
| 2015 | 10,724 | 6,820 | 12,215 | 9,548 | 8,174 | 8,186 | 7,917 | 9,446 | 10,415 | 13,430 | 13,699 | 15,547 |
| 2016 | 13,626 | 9,210 | 10,061 | 12,156 | 4,406 | 6,005 | 6,586 | 8,928 | 11,885 | 11,508 | 10,764 | 7,556 |
| 2017 | 7,093 | 7,063 | 4,983 | 2,007 | 3,654 | 3,345 | 5,401 | 5,557 | 7,555 | 8,071 | 6,903 | 11,430 |
| 2018 | 4,133 | 2,990 | 5,224 | 2,710 | 2,648 | 1,858 | 1,545 | 1,124 | 1,463 | 1,714 | 2,519 | 2,490 |
| 2019 | 2,111 | 1,048 | 2,528 | 2,116 | 1,565 | 1,367 | 1,059 | 1,320 | 2,033 | 2,555 | 1,005 | 1,019 |
| 2020 | 800 | - | 164 | - | - | - | - | - | - | - | - | - |
| Total | 40,129 | 28,830 | 38,147 | 32,008 | 25,239 | 24,809 | 28,448 | 32,265 | 40,343 | 45,443 | 43,111 | 49,026 |
Year | Q1 | Q2 | Q3 | Q4 |
|---|---|---|---|---|
| 2013 | - | - | - | 433 |
| 2014 | 6,313 | 12,311 | 18,822 | 26,937 |
| 2015 | 29,759 | 25,908 | 27,778 | 42,676 |
| 2016 | 32,897 | 22,567 | 27,399 | 29,828 |
| 2017 | 19,139 | 9,006 | 18,513 | 26,404 |
| 2018 | 12,347 | 7,216 | 4,132 | 6,723 |
| 2019 | 5,687 | 5,048 | 4,412 | 4,579 |
| 2020 | 964 | - | - | - |
| Total | 107,106 | 82,056 | 101,056 | 137,580 |
Year | Sales |
|---|---|
| 2020 | 964 |
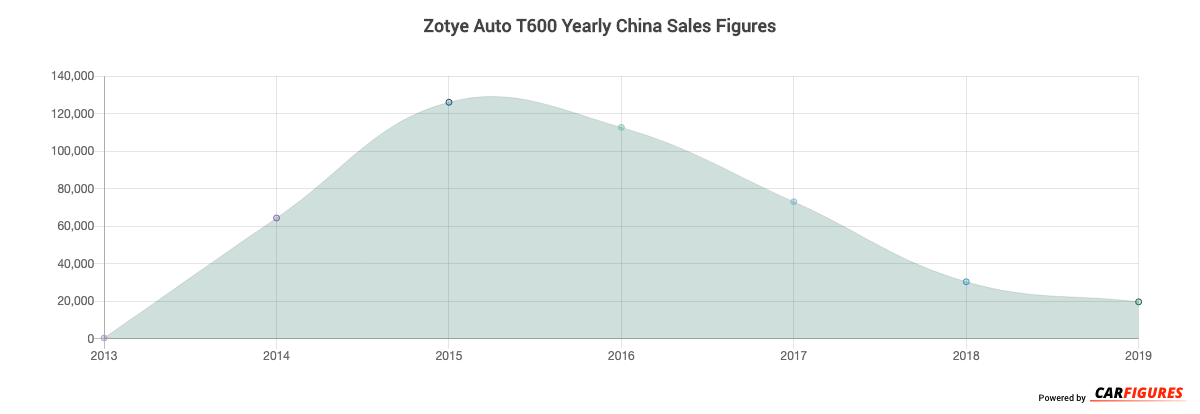
| 2019 | 19,726 |
| 2018 | 30,418 |
| 2017 | 73,062 |
| 2016 | 112,691 |
| 2015 | 126,121 |
| 2014 | 64,383 |
| 2013 | 433 |
| Total | 427,798 |
Download Historic Sales Data
Embedded Code
See more widgetsSources: Manufacturers