Key Stats
How many Lamando did Volkswagen sell in 2020?
Volkswagen sold 34,684 Lamando in 2020. (From Jan - Dec 2020)
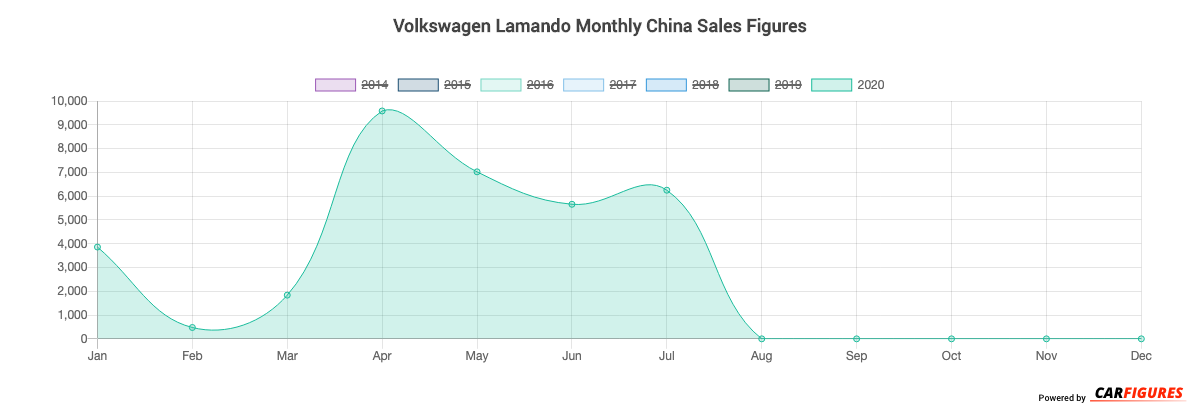
How many Lamando did Volkswagen sell in July 2020?
Volkswagen sold 6,249 Lamando in July 2020.
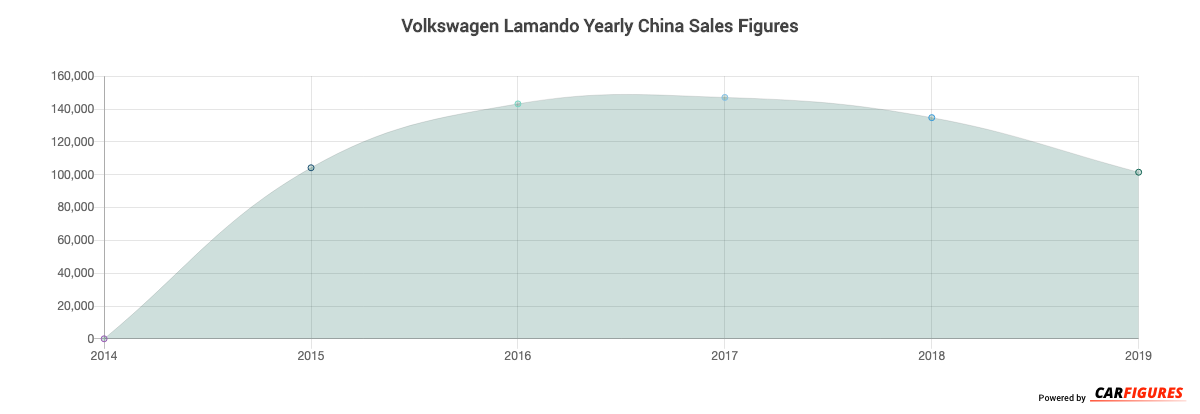
How many Lamando did Volkswagen sell in 2019?
Volkswagen sold 101,505 Lamando in 2019. In 2018, Volkswagen sold 134,746 Lamando. They sold 33,241 more units in year 2018 compared to 2019 with a percent loss of 24.67% YoY.
Overview
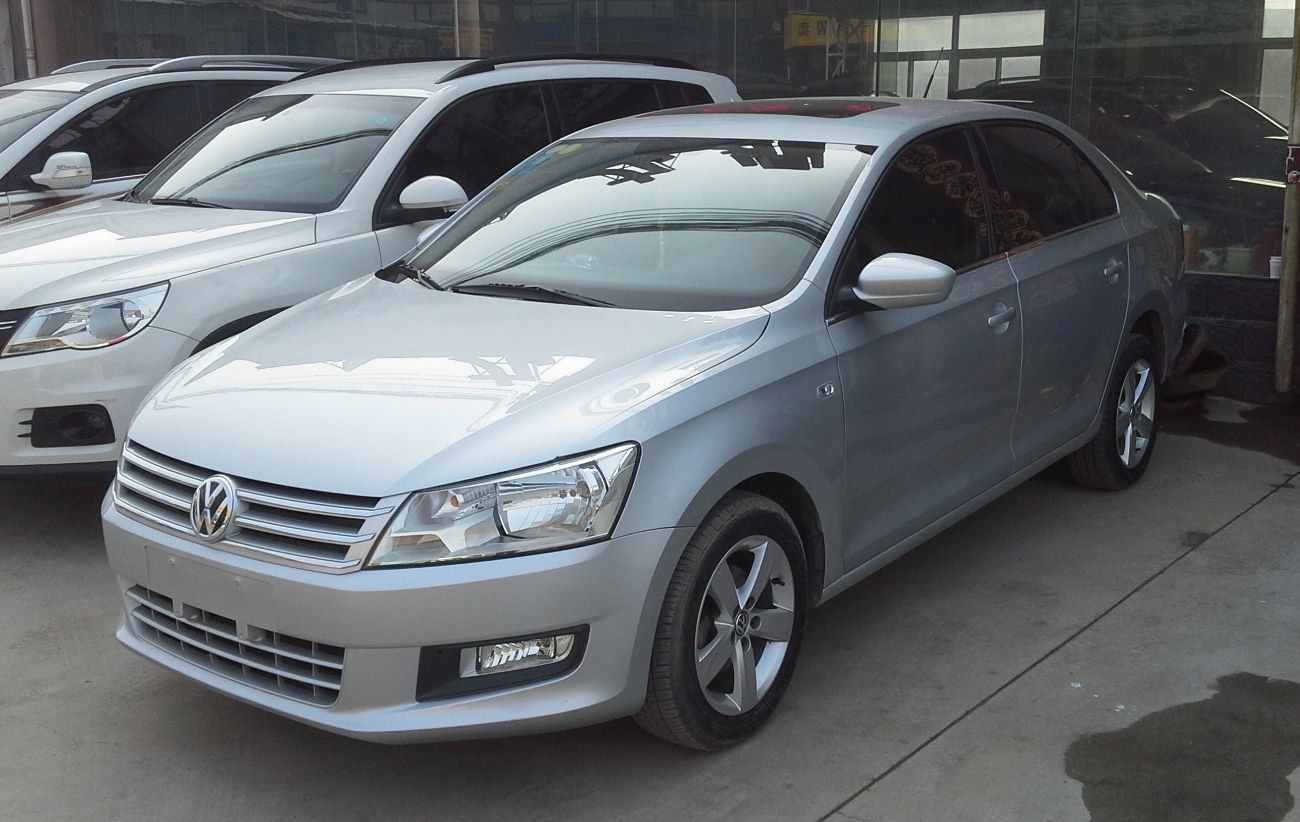
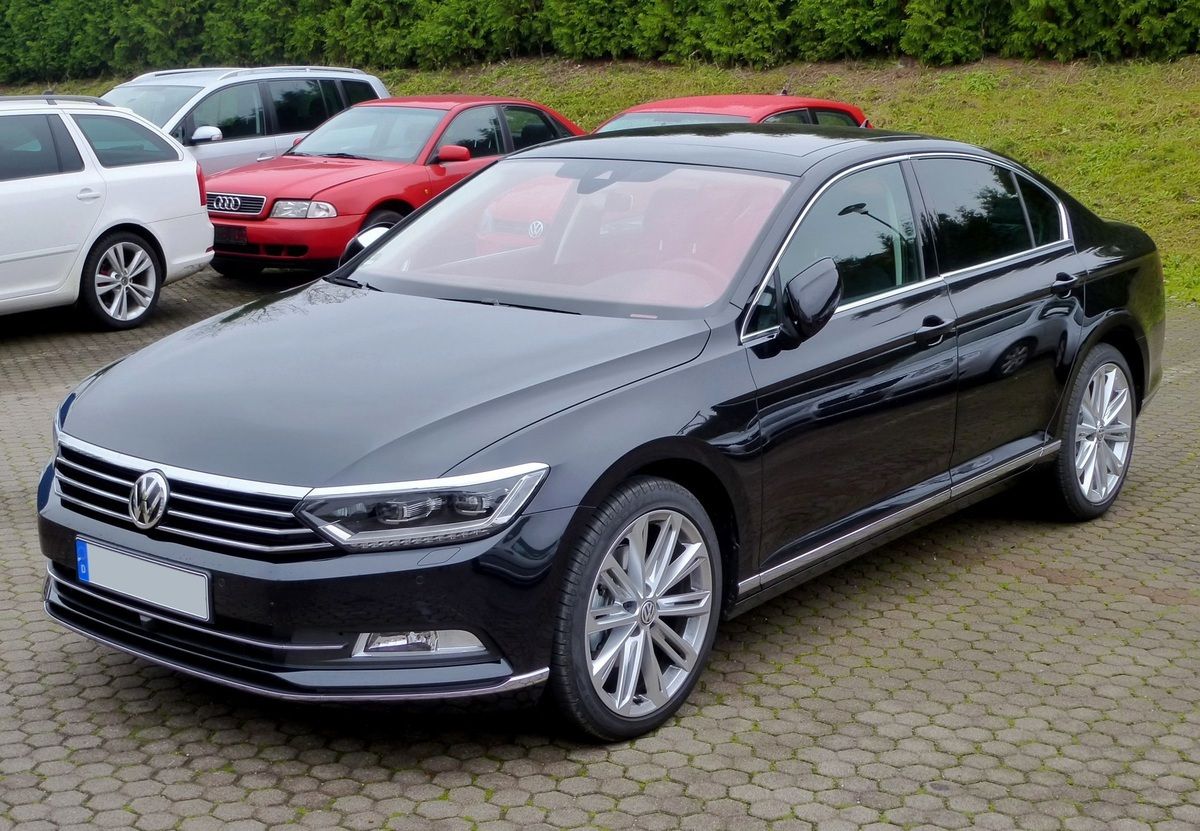
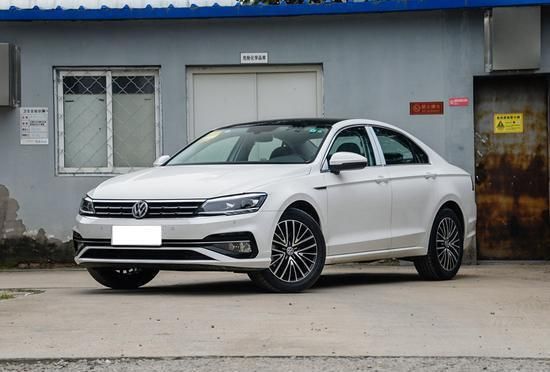
The Lamando is a 4-door 5-seater sedan with room for 5 people.
How Much Does the Volkswagen Lamando Cost?
The Lamando starts at CN¥145,900 Yuan ($20,426 USD) MSRP. Fully equipped, the Lamando will cost you about CN¥201,900 Yuan ($28,266 USD).
Volkswagen Lamando Engine and Performance
Lamando is powered by a 1.4TL engine that makes 96 Kw (128.74 HP) - 110 Kw (147.51 HP) and 225 Nm (166.50 ft-lb) - 250 Nm (185.00 ft-lb) torque.
Volkswagen Lamando Specifications
The Lamando has a curb weight of 1,300 kg (2,900 lbs) - 1,400 kg (3,000 lbs).
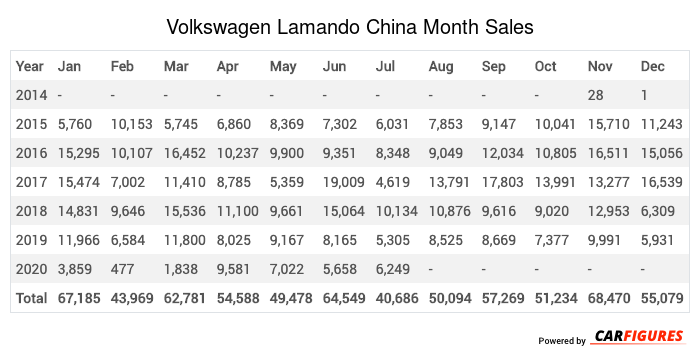
Volkswagen Lamando China Sale figures by year, quarter, and month are presented below. Including the most up to date sales data for the Volkswagen Lamando.
Year | Jan | Feb | Mar | Apr | May | Jun | Jul | Aug | Sep | Oct | Nov | Dec |
|---|---|---|---|---|---|---|---|---|---|---|---|---|
| 2014 | - | - | - | - | - | - | - | - | - | - | 28 | 1 |
| 2015 | 5,760 | 10,153 | 5,745 | 6,860 | 8,369 | 7,302 | 6,031 | 7,853 | 9,147 | 10,041 | 15,710 | 11,243 |
| 2016 | 15,295 | 10,107 | 16,452 | 10,237 | 9,900 | 9,351 | 8,348 | 9,049 | 12,034 | 10,805 | 16,511 | 15,056 |
| 2017 | 15,474 | 7,002 | 11,410 | 8,785 | 5,359 | 19,009 | 4,619 | 13,791 | 17,803 | 13,991 | 13,277 | 16,539 |
| 2018 | 14,831 | 9,646 | 15,536 | 11,100 | 9,661 | 15,064 | 10,134 | 10,876 | 9,616 | 9,020 | 12,953 | 6,309 |
| 2019 | 11,966 | 6,584 | 11,800 | 8,025 | 9,167 | 8,165 | 5,305 | 8,525 | 8,669 | 7,377 | 9,991 | 5,931 |
| 2020 | 3,859 | 477 | 1,838 | 9,581 | 7,022 | 5,658 | 6,249 | - | - | - | - | - |
| Total | 67,185 | 43,969 | 62,781 | 54,588 | 49,478 | 64,549 | 40,686 | 50,094 | 57,269 | 51,234 | 68,470 | 55,079 |
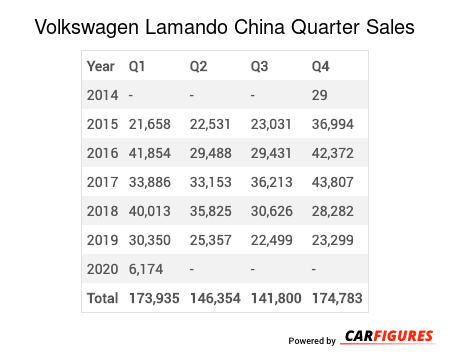
Year | Q1 | Q2 | Q3 | Q4 |
|---|---|---|---|---|
| 2014 | - | - | - | 29 |
| 2015 | 21,658 | 22,531 | 23,031 | 36,994 |
| 2016 | 41,854 | 29,488 | 29,431 | 42,372 |
| 2017 | 33,886 | 33,153 | 36,213 | 43,807 |
| 2018 | 40,013 | 35,825 | 30,626 | 28,282 |
| 2019 | 30,350 | 25,357 | 22,499 | 23,299 |
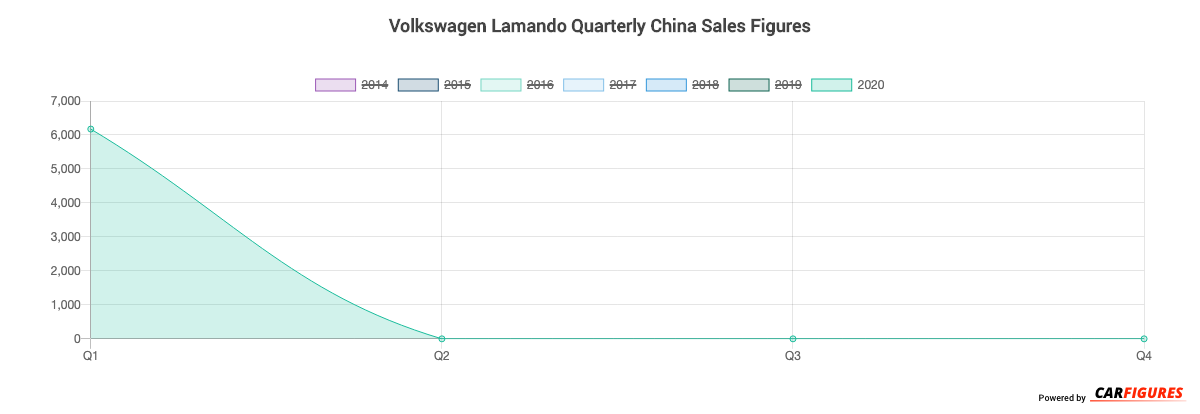
| 2020 | 6,174 | - | - | - |
| Total | 173,935 | 146,354 | 141,800 | 174,783 |
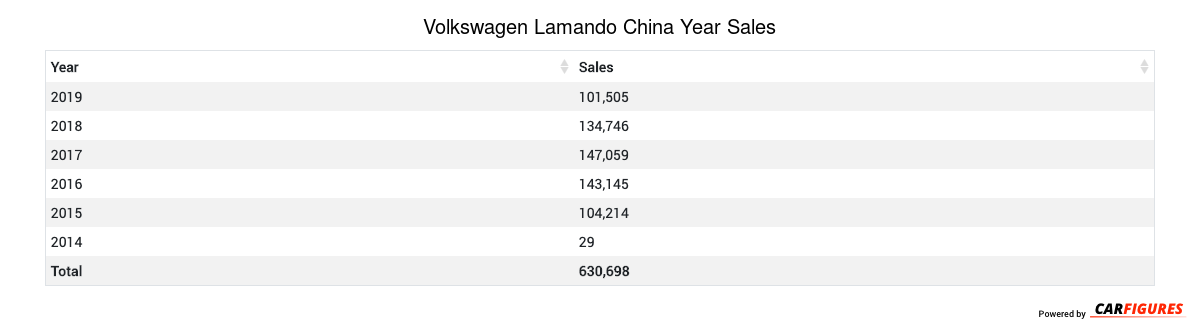
Year | Sales |
|---|---|
| 2020 | 6,174 |
| 2019 | 101,505 |
| 2018 | 134,746 |
| 2017 | 147,059 |
| 2016 | 143,145 |
| 2015 | 104,214 |
| 2014 | 29 |
| Total | 636,872 |
Download Historic Sales Data
Embedded Code
See more widgetsSources: Manufacturers