Key Stats
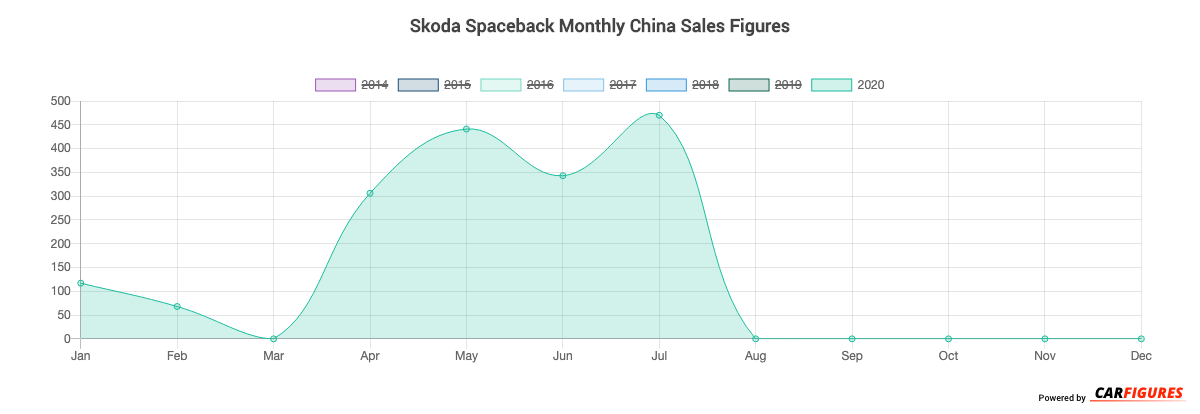
How many Spaceback did Skoda sell in 2020?
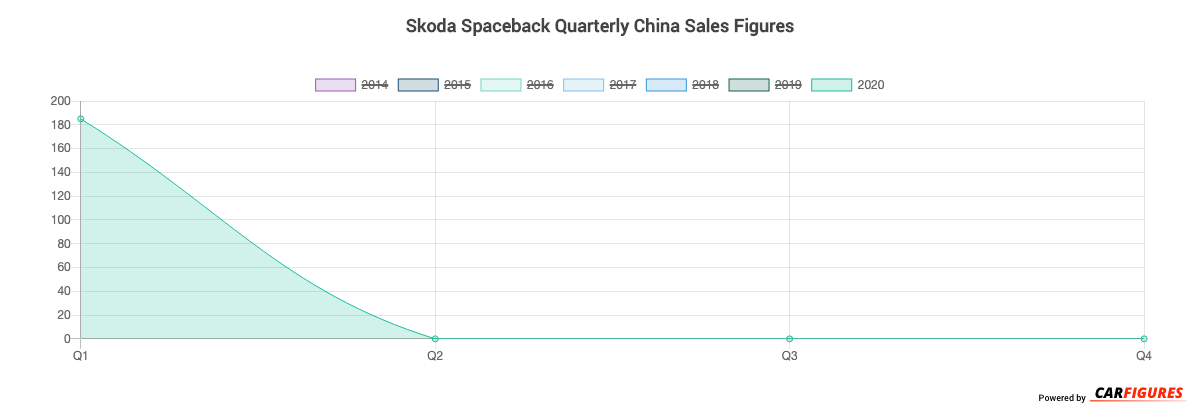
Skoda sold 1,745 Spaceback in 2020. (From Jan - Dec 2020)
How many Spaceback did Skoda sell in July 2020?
Skoda sold 470 Spaceback in July 2020.
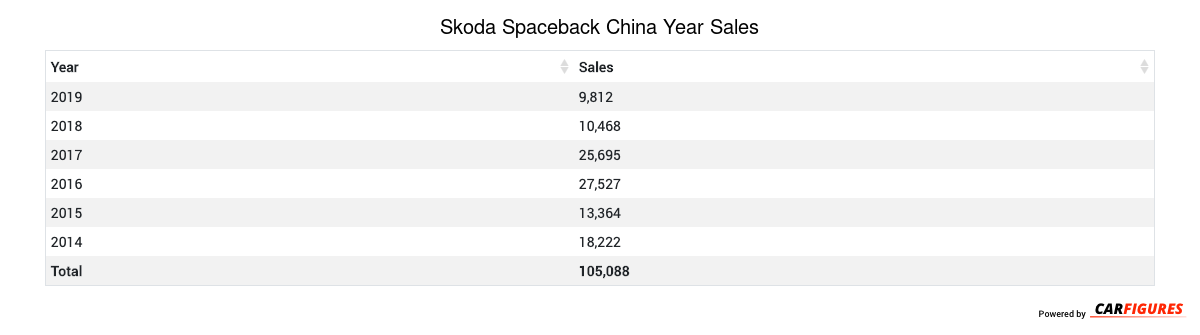
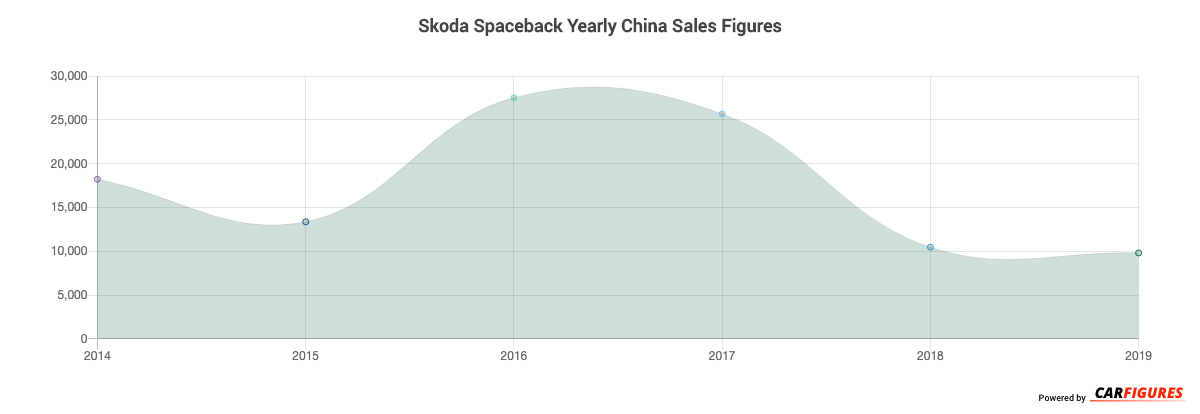
How many Spaceback did Skoda sell in 2019?
Skoda sold 9,812 Spaceback in 2019. In 2018, Skoda sold 10,468 Spaceback. They sold 656 more units in year 2018 compared to 2019 with a percent loss of 6.27% YoY.
Overview
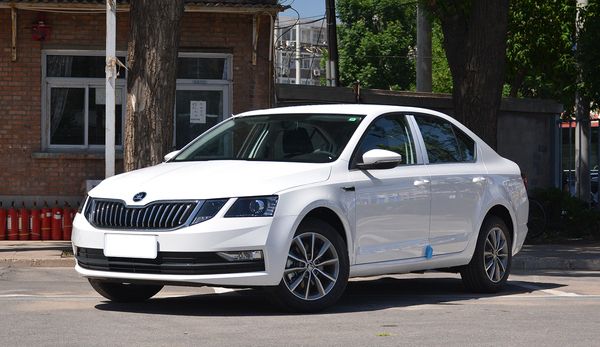
The Spaceback is a 5-door 5-seater hatchback with room for 5 people.
How Much Does the Skoda Spaceback Cost?
The Spaceback starts at CN¥69,900 Yuan ($9,786 USD) MSRP. Fully equipped, the Spaceback will cost you about CN¥119,900 Yuan ($16,786 USD).
Skoda Spaceback Engine and Performance
Spaceback includes a 1.4LL engine. This delivers 66 Kw (88.51 HP) - 96 Kw (128.74 HP) and 132 Nm (97.68 ft-lb) - 225 Nm (166.50 ft-lb) torque.
Skoda Spaceback Specifications
The Spaceback has a curb weight of 1,100 kg (2,500 lbs) - 1,200 kg (2,600 lbs).
Skoda Spaceback China Sale figures by year, quarter, and month are presented below. Including the most up to date sales data for the Skoda Spaceback.
Year | Jan | Feb | Mar | Apr | May | Jun | Jul | Aug | Sep | Oct | Nov | Dec |
|---|---|---|---|---|---|---|---|---|---|---|---|---|
| 2014 | - | - | 459 | 1,655 | 1,553 | 1,910 | 2,520 | 2,745 | 1,877 | 1,803 | 1,867 | 1,833 |
| 2015 | 1,804 | 933 | 1,765 | 1,206 | 1,499 | 967 | 693 | 641 | 1,111 | 839 | 896 | 1,010 |
| 2016 | 1,034 | 1,062 | 2,176 | 2,420 | 2,227 | 2,542 | 1,825 | 2,540 | 3,809 | 3,596 | 2,237 | 2,059 |
| 2017 | 3,746 | 2,322 | 2,749 | 2,200 | 2,243 | 2,028 | 1,123 | 1,678 | 1,963 | 1,787 | 2,079 | 1,777 |
| 2018 | 1,365 | 767 | 747 | 1,051 | 1,591 | 1,388 | 452 | 710 | 735 | 437 | 498 | 727 |
| 2019 | 436 | 2,924 | 683 | 267 | 452 | 628 | 533 | 789 | 843 | 769 | 606 | 882 |
| 2020 | 117 | 68 | - | 306 | 441 | 343 | 470 | - | - | - | - | - |
| Total | 8,502 | 8,076 | 8,579 | 9,105 | 10,006 | 9,806 | 7,616 | 9,103 | 10,338 | 9,231 | 8,183 | 8,288 |
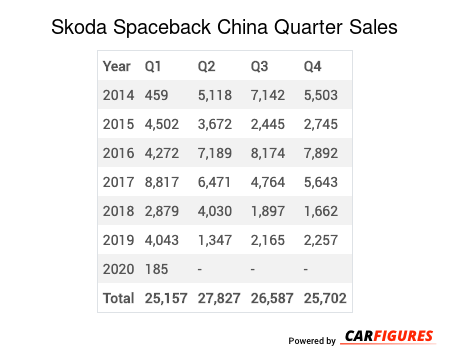
Year | Q1 | Q2 | Q3 | Q4 |
|---|---|---|---|---|
| 2014 | 459 | 5,118 | 7,142 | 5,503 |
| 2015 | 4,502 | 3,672 | 2,445 | 2,745 |
| 2016 | 4,272 | 7,189 | 8,174 | 7,892 |
| 2017 | 8,817 | 6,471 | 4,764 | 5,643 |
| 2018 | 2,879 | 4,030 | 1,897 | 1,662 |
| 2019 | 4,043 | 1,347 | 2,165 | 2,257 |
| 2020 | 185 | - | - | - |
| Total | 25,157 | 27,827 | 26,587 | 25,702 |
Year | Sales |
|---|---|
| 2020 | 185 |
| 2019 | 9,812 |
| 2018 | 10,468 |
| 2017 | 25,695 |
| 2016 | 27,527 |
| 2015 | 13,364 |
| 2014 | 18,222 |
| Total | 105,273 |
Download Historic Sales Data

Embedded Code
See more widgetsSources: Manufacturers