Key Stats
How many C Class did Mercedes-Benz sell in 2020?
Mercedes-Benz sold 84,690 C Class in 2020. (From Jan - Dec 2020)
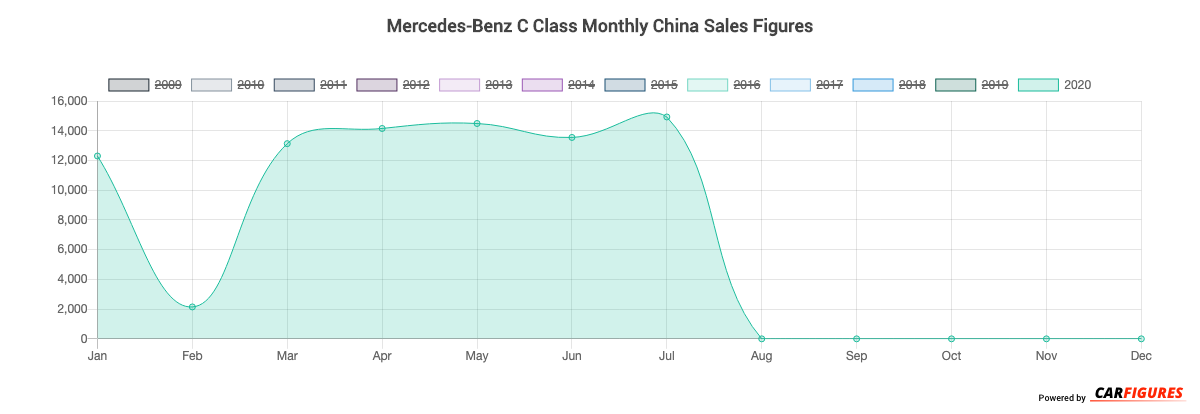
How many C Class did Mercedes-Benz sell in July 2020?
Mercedes-Benz sold 14,925 C Class in July 2020.
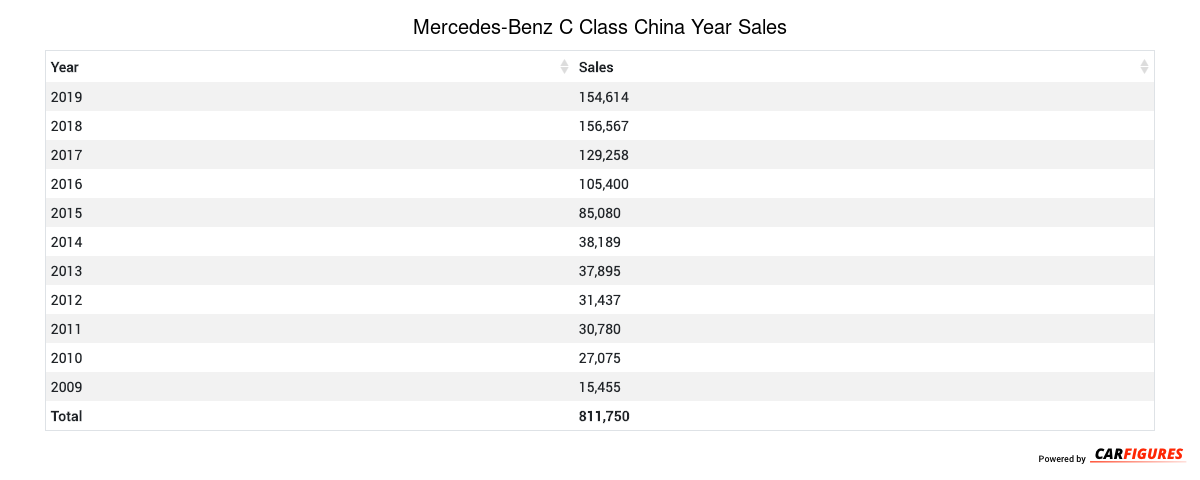
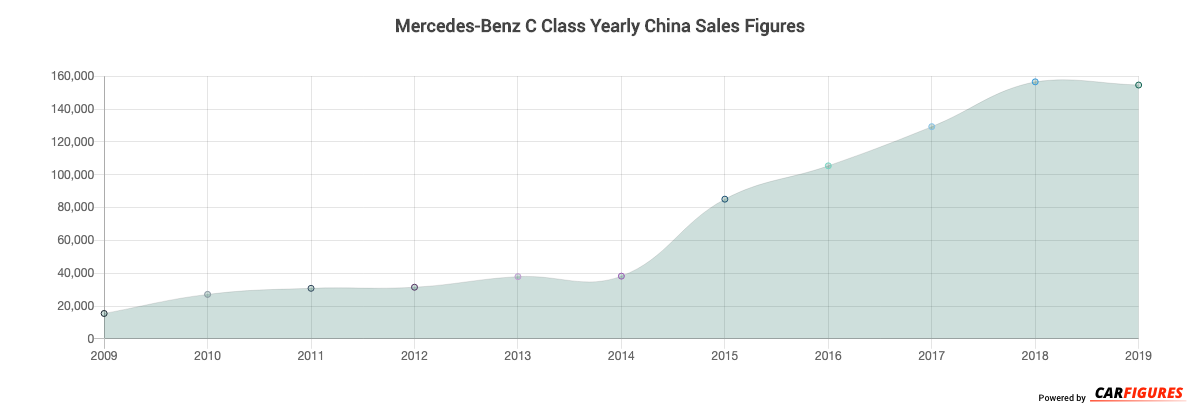
How many C Class did Mercedes-Benz sell in 2019?
Mercedes-Benz sold 154,614 C Class in 2019. In 2018, Mercedes-Benz sold 156,567 C Class. They sold 1,953 more units in year 2018 compared to 2019 with a percent loss of 1.25% YoY.
Overview
The C Class is a 4-door 5-seater sedan with room for 5 people.
How Much Does the Mercedes-Benz C Class Cost?
The C Class starts at CN¥315,800 Yuan ($44,212 USD) MSRP. Fully equipped, the C Class will cost you about CN¥486,800 Yuan ($68,152 USD).
Mercedes-Benz C Class Engine and Performance
C Class is powered by a 1.5TL engine that makes 115 Kw (154.22 HP) - 190 Kw (254.79 HP) and 250 Nm (185.00 ft-lb) - 370 Nm (273.80 ft-lb) torque.
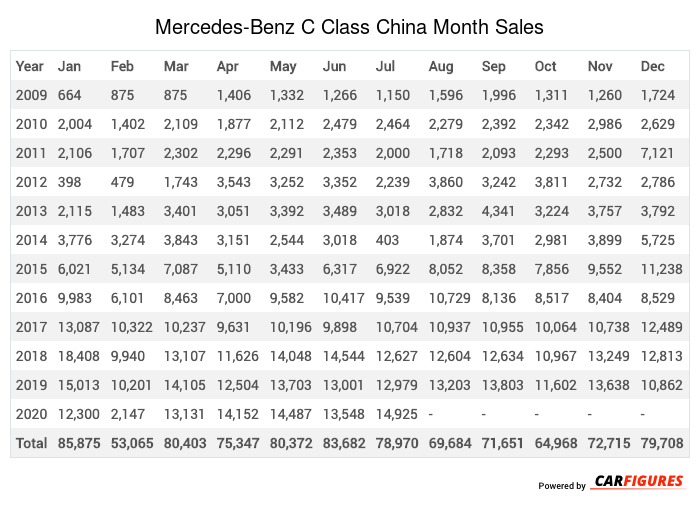
Mercedes-Benz C Class China Sale figures by year, quarter, and month are presented below. Including the most up to date sales data for the Mercedes-Benz C Class.
Year | Jan | Feb | Mar | Apr | May | Jun | Jul | Aug | Sep | Oct | Nov | Dec |
|---|---|---|---|---|---|---|---|---|---|---|---|---|
| 2009 | 664 | 875 | 875 | 1,406 | 1,332 | 1,266 | 1,150 | 1,596 | 1,996 | 1,311 | 1,260 | 1,724 |
| 2010 | 2,004 | 1,402 | 2,109 | 1,877 | 2,112 | 2,479 | 2,464 | 2,279 | 2,392 | 2,342 | 2,986 | 2,629 |
| 2011 | 2,106 | 1,707 | 2,302 | 2,296 | 2,291 | 2,353 | 2,000 | 1,718 | 2,093 | 2,293 | 2,500 | 7,121 |
| 2012 | 398 | 479 | 1,743 | 3,543 | 3,252 | 3,352 | 2,239 | 3,860 | 3,242 | 3,811 | 2,732 | 2,786 |
| 2013 | 2,115 | 1,483 | 3,401 | 3,051 | 3,392 | 3,489 | 3,018 | 2,832 | 4,341 | 3,224 | 3,757 | 3,792 |
| 2014 | 3,776 | 3,274 | 3,843 | 3,151 | 2,544 | 3,018 | 403 | 1,874 | 3,701 | 2,981 | 3,899 | 5,725 |
| 2015 | 6,021 | 5,134 | 7,087 | 5,110 | 3,433 | 6,317 | 6,922 | 8,052 | 8,358 | 7,856 | 9,552 | 11,238 |
| 2016 | 9,983 | 6,101 | 8,463 | 7,000 | 9,582 | 10,417 | 9,539 | 10,729 | 8,136 | 8,517 | 8,404 | 8,529 |
| 2017 | 13,087 | 10,322 | 10,237 | 9,631 | 10,196 | 9,898 | 10,704 | 10,937 | 10,955 | 10,064 | 10,738 | 12,489 |
| 2018 | 18,408 | 9,940 | 13,107 | 11,626 | 14,048 | 14,544 | 12,627 | 12,604 | 12,634 | 10,967 | 13,249 | 12,813 |
| 2019 | 15,013 | 10,201 | 14,105 | 12,504 | 13,703 | 13,001 | 12,979 | 13,203 | 13,803 | 11,602 | 13,638 | 10,862 |
| 2020 | 12,300 | 2,147 | 13,131 | 14,152 | 14,487 | 13,548 | 14,925 | - | - | - | - | - |
| Total | 85,875 | 53,065 | 80,403 | 75,347 | 80,372 | 83,682 | 78,970 | 69,684 | 71,651 | 64,968 | 72,715 | 79,708 |
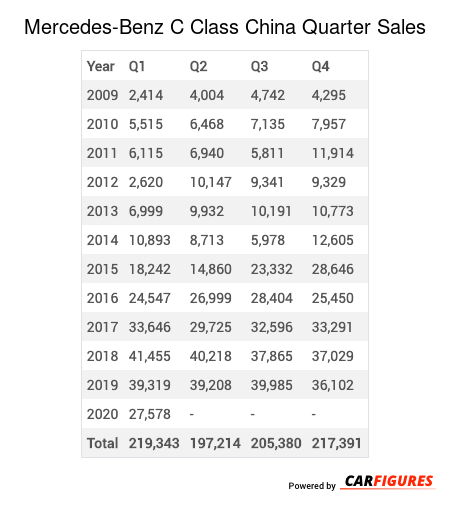
Year | Q1 | Q2 | Q3 | Q4 |
|---|---|---|---|---|
| 2009 | 2,414 | 4,004 | 4,742 | 4,295 |
| 2010 | 5,515 | 6,468 | 7,135 | 7,957 |
| 2011 | 6,115 | 6,940 | 5,811 | 11,914 |
| 2012 | 2,620 | 10,147 | 9,341 | 9,329 |
| 2013 | 6,999 | 9,932 | 10,191 | 10,773 |
| 2014 | 10,893 | 8,713 | 5,978 | 12,605 |
| 2015 | 18,242 | 14,860 | 23,332 | 28,646 |
| 2016 | 24,547 | 26,999 | 28,404 | 25,450 |
| 2017 | 33,646 | 29,725 | 32,596 | 33,291 |
| 2018 | 41,455 | 40,218 | 37,865 | 37,029 |
| 2019 | 39,319 | 39,208 | 39,985 | 36,102 |
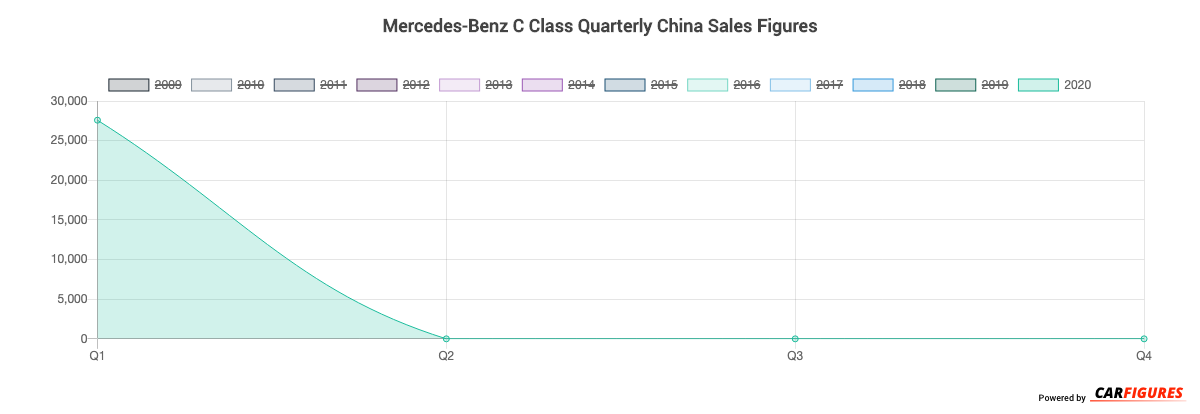
| 2020 | 27,578 | - | - | - |
| Total | 219,343 | 197,214 | 205,380 | 217,391 |
Year | Sales |
|---|---|
| 2020 | 27,578 |
| 2019 | 154,614 |
| 2018 | 156,567 |
| 2017 | 129,258 |
| 2016 | 105,400 |
| 2015 | 85,080 |
| 2014 | 38,189 |
| 2013 | 37,895 |
| 2012 | 31,437 |
| 2011 | 30,780 |
| 2010 | 27,075 |
| 2009 | 15,455 |
| Total | 839,328 |
Download Historic Sales Data
Embedded Code
See more widgetsSources: Manufacturers