Last updated: May 15, 2020
Key Stats
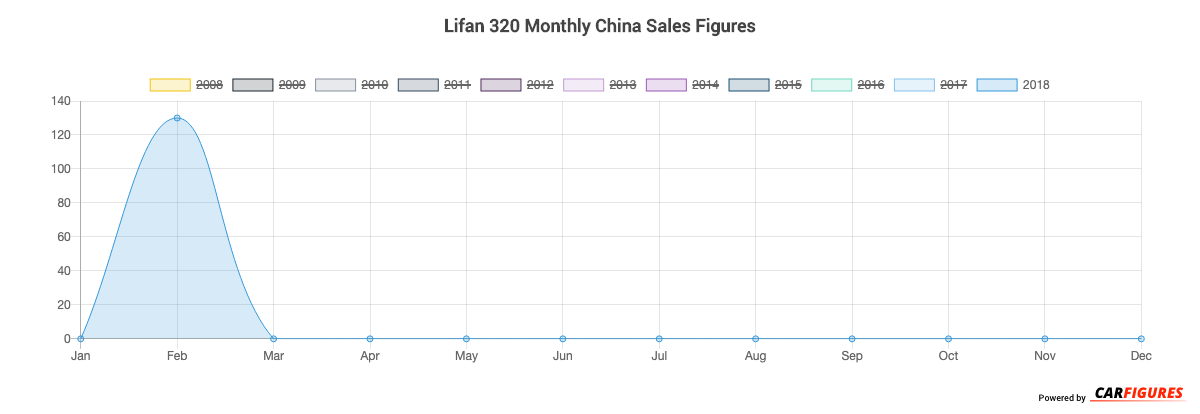
How many 320 did Lifan sell in February 2018?
Lifan sold 130 320 in February 2018.
Overview
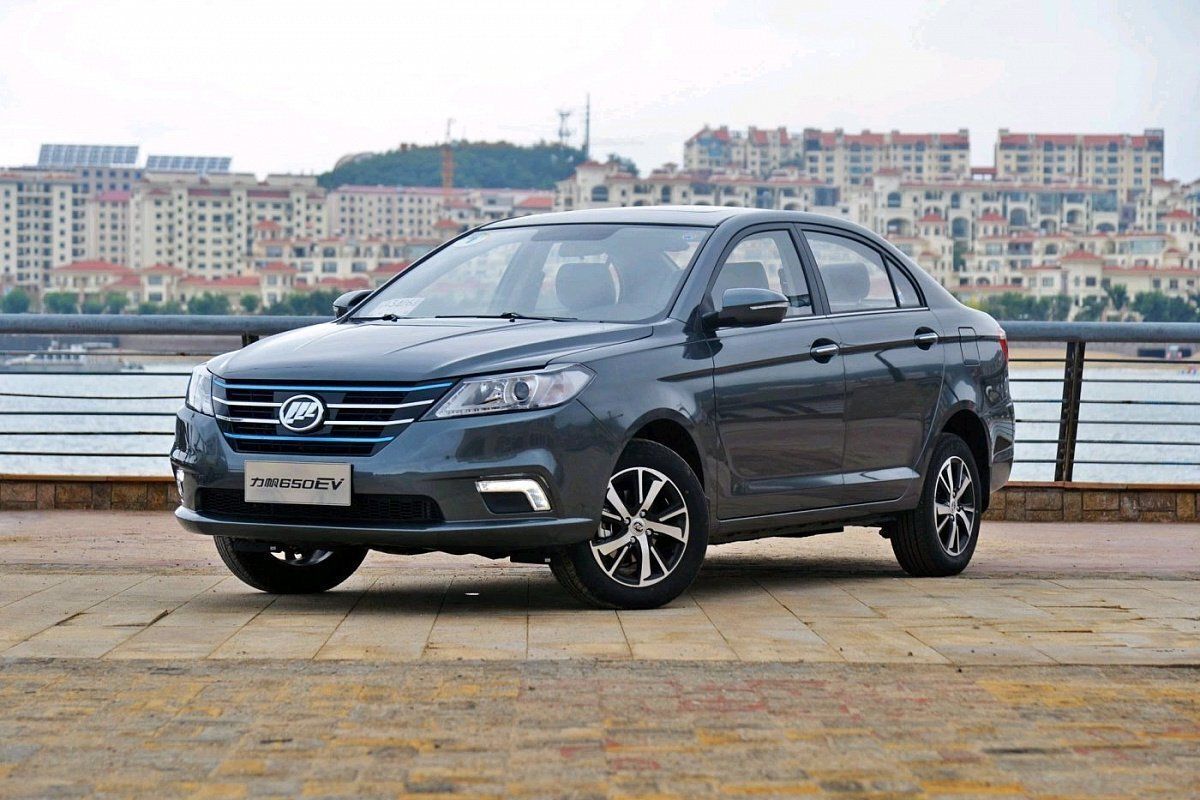
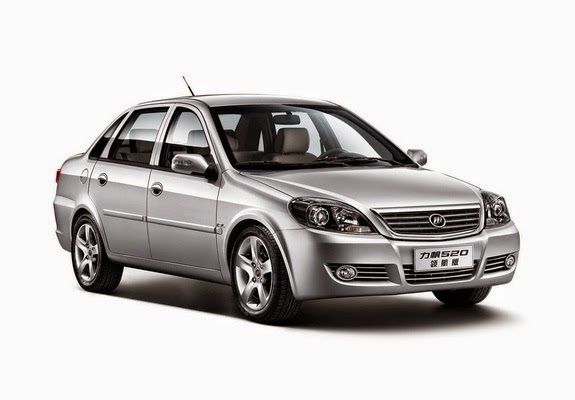
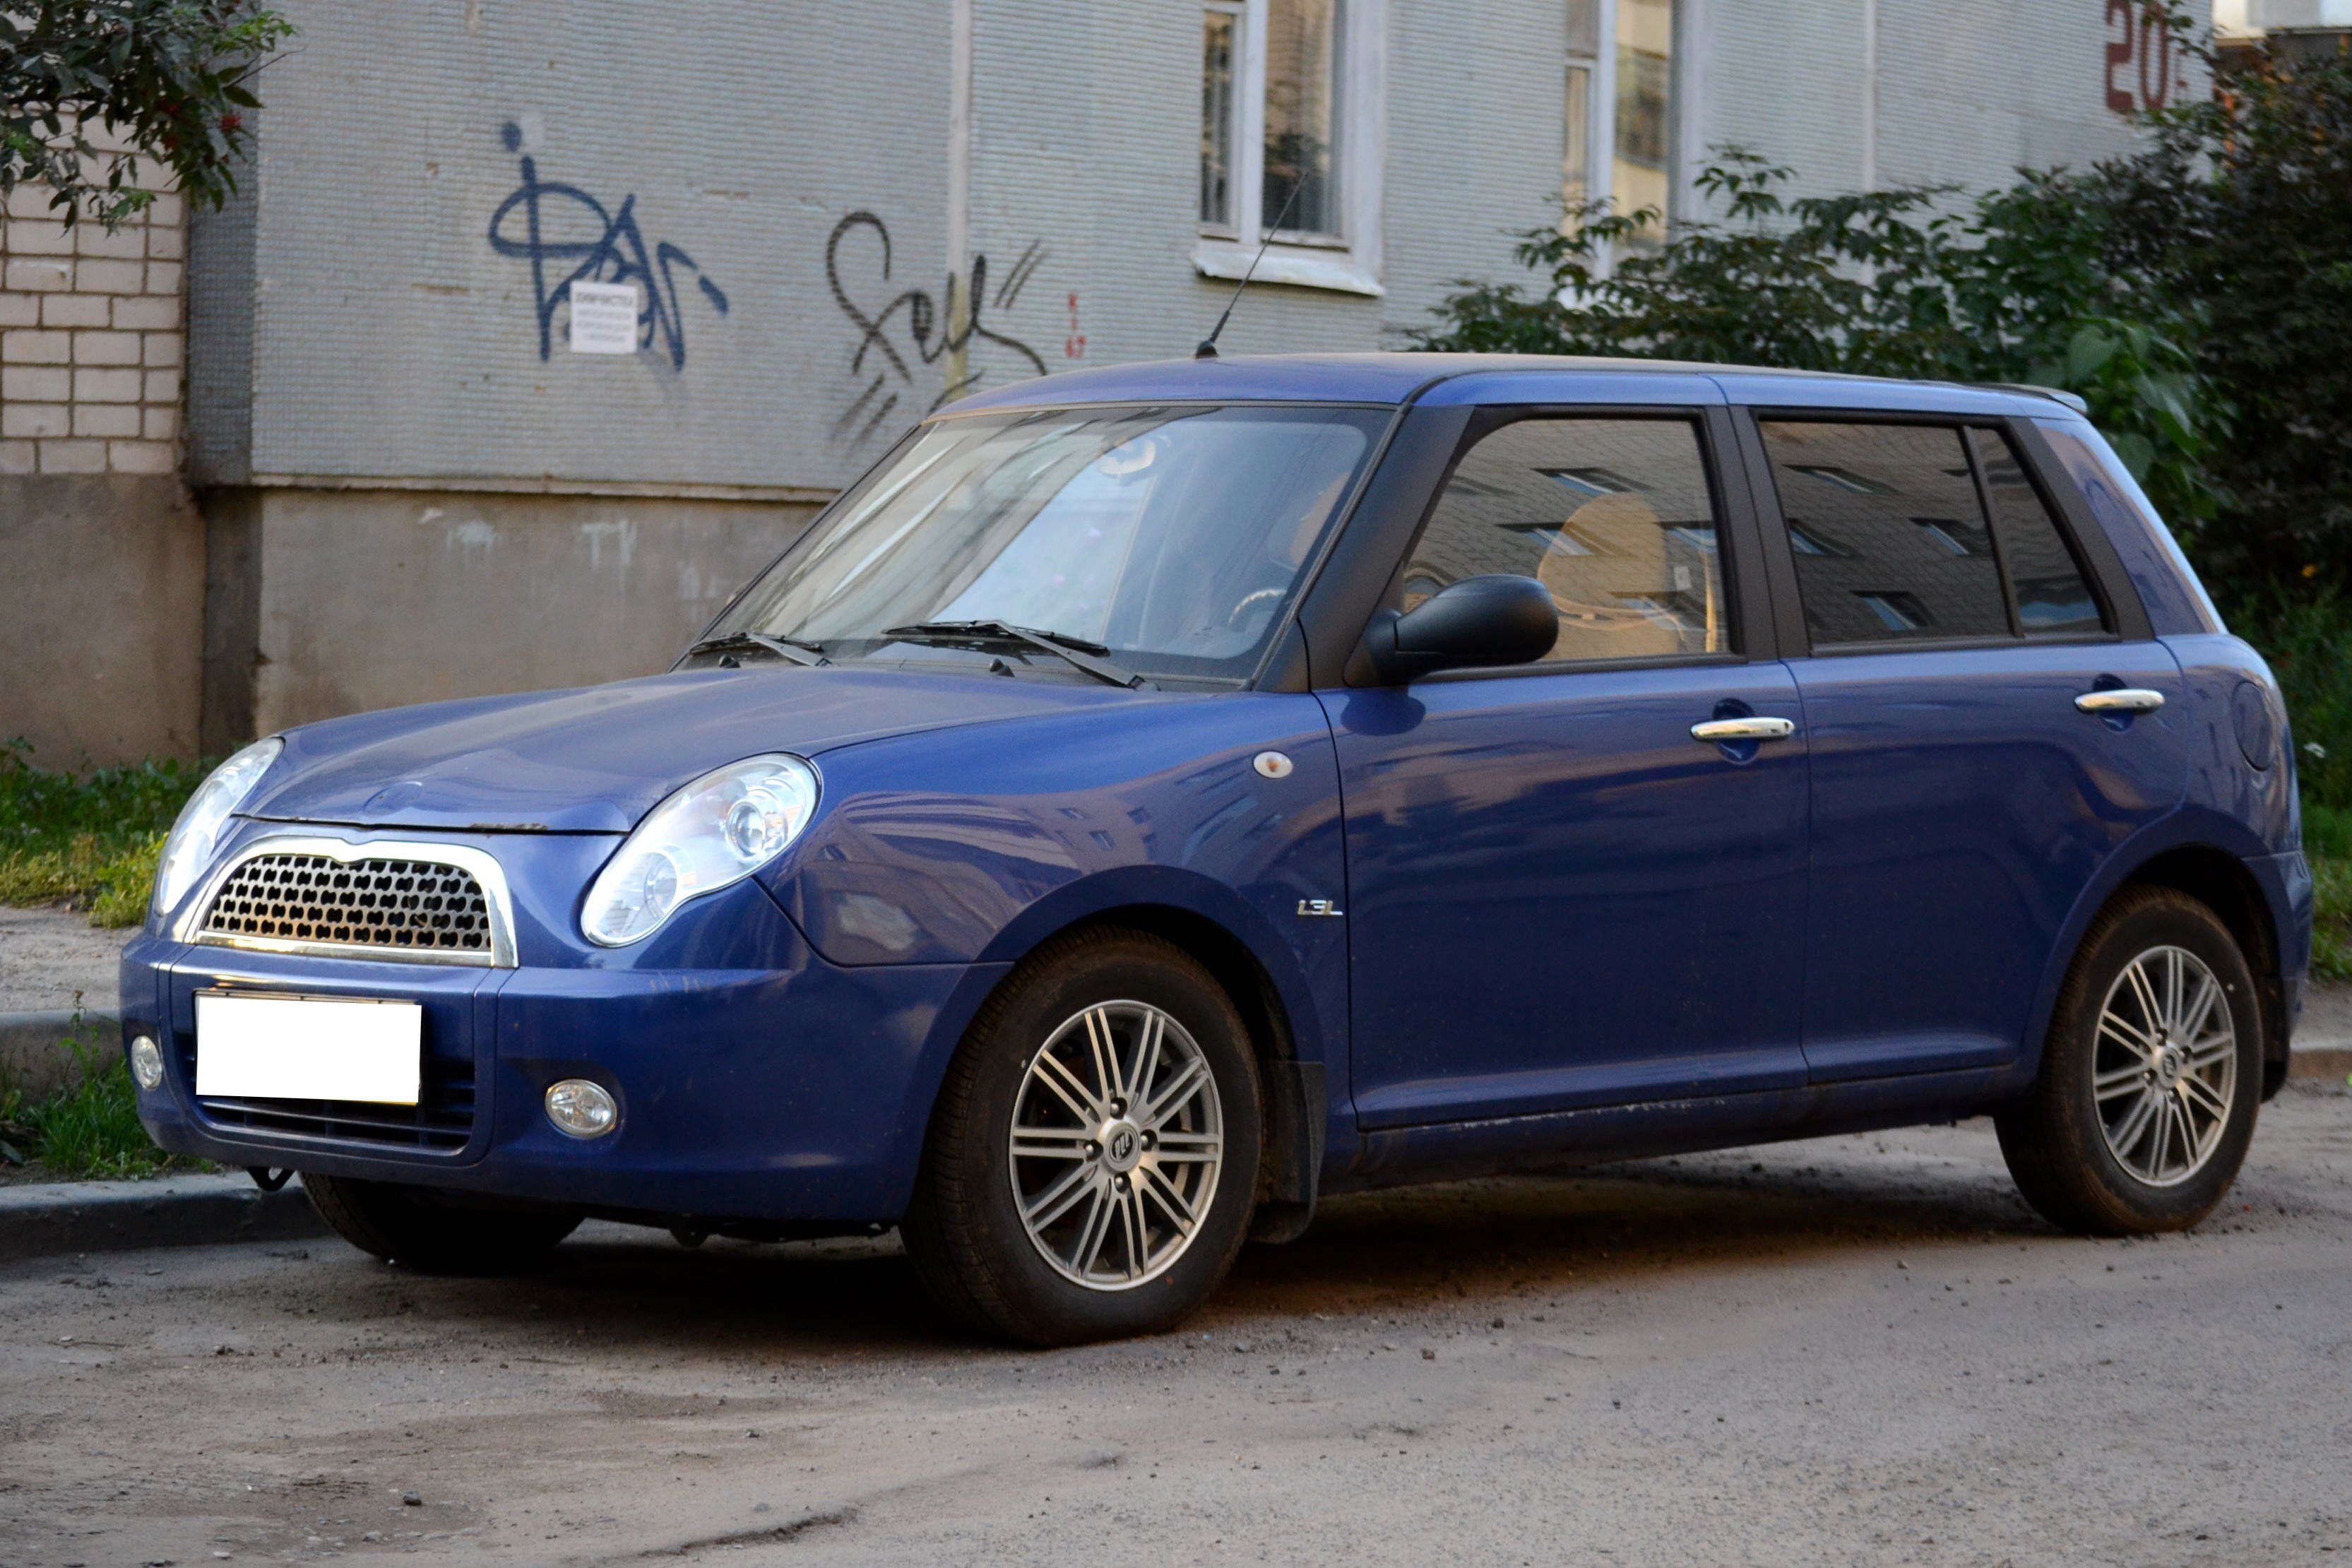
The 320 is a vehicle from automaker Lifan.
How Much Does the Lifan 320 Cost?
The 320 starts at CN¥36,500 Yuan ($5,110 USD) MSRP. Fully equipped, the 320 will cost you about CN¥54,900 Yuan ($7,686 USD).
Lifan 320 Engine and Performance
320 includes a 1.3L engine. This delivers 65 Kw (87.17 HP) - 65 Kw (87.17 HP) and 110 Nm (81.40 ft-lb) - 110 Nm (81.40 ft-lb) torque.
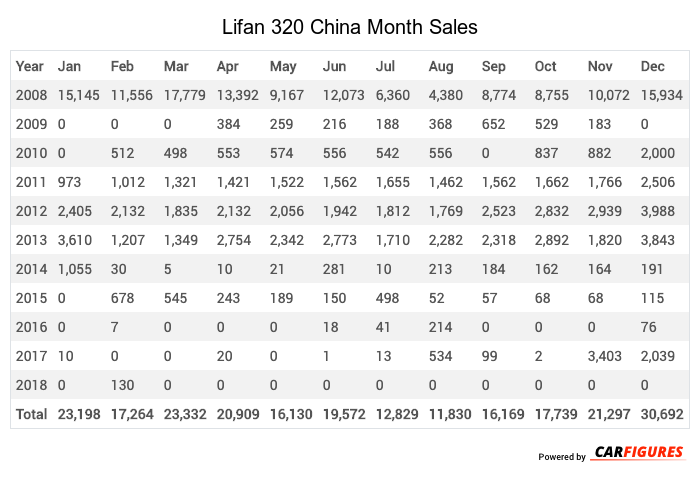
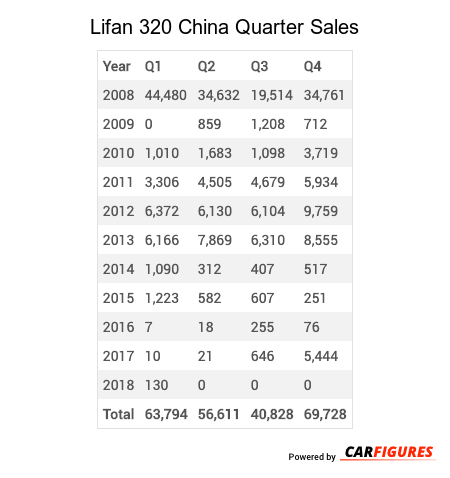
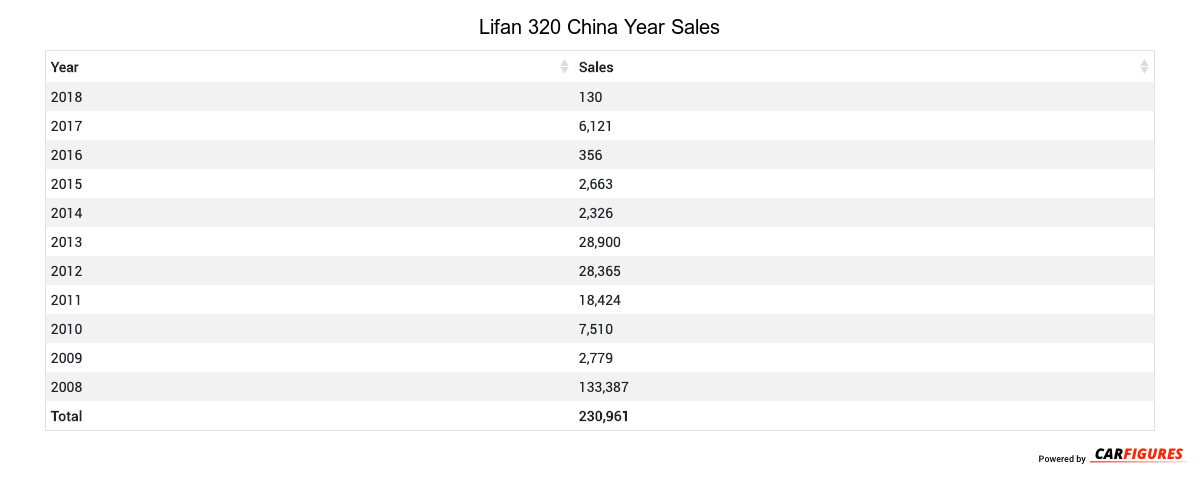
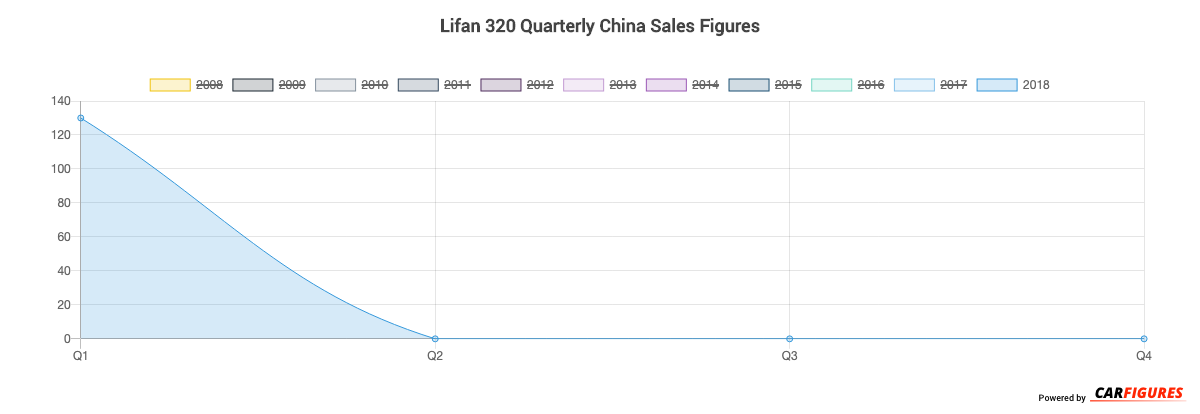
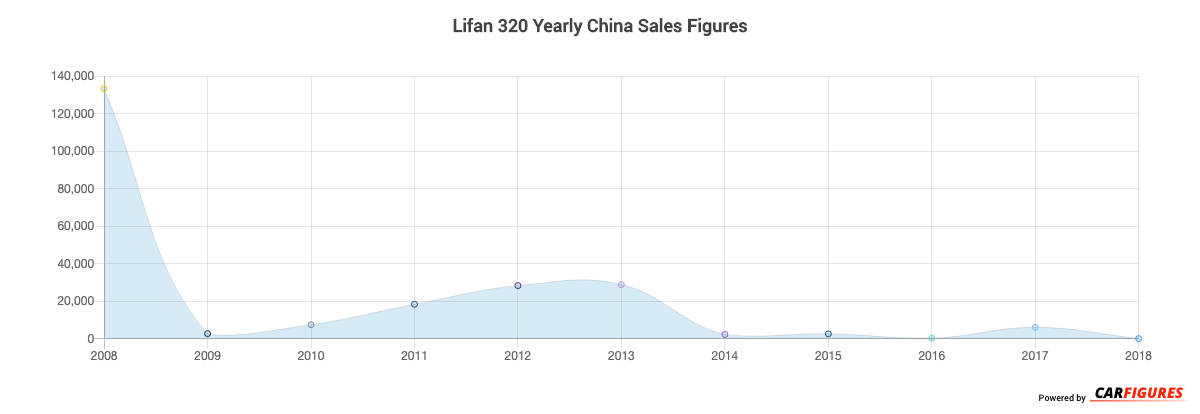
Lifan 320 China Sale figures by year, quarter, and month are presented below. Including the most up to date sales data for the Lifan 320.
Loading, please wait
Year | Jan | Feb | Mar | Apr | May | Jun | Jul | Aug | Sep | Oct | Nov | Dec |
|---|---|---|---|---|---|---|---|---|---|---|---|---|
| 2008 | 15,145 | 11,556 | 17,779 | 13,392 | 9,167 | 12,073 | 6,360 | 4,380 | 8,774 | 8,755 | 10,072 | 15,934 |
| 2009 | 0 | 0 | 0 | 384 | 259 | 216 | 188 | 368 | 652 | 529 | 183 | 0 |
| 2010 | 0 | 512 | 498 | 553 | 574 | 556 | 542 | 556 | 0 | 837 | 882 | 2,000 |
| 2011 | 973 | 1,012 | 1,321 | 1,421 | 1,522 | 1,562 | 1,655 | 1,462 | 1,562 | 1,662 | 1,766 | 2,506 |
| 2012 | 2,405 | 2,132 | 1,835 | 2,132 | 2,056 | 1,942 | 1,812 | 1,769 | 2,523 | 2,832 | 2,939 | 3,988 |
| 2013 | 3,610 | 1,207 | 1,349 | 2,754 | 2,342 | 2,773 | 1,710 | 2,282 | 2,318 | 2,892 | 1,820 | 3,843 |
| 2014 | 1,055 | 30 | 5 | 10 | 21 | 281 | 10 | 213 | 184 | 162 | 164 | 191 |
| 2015 | 0 | 678 | 545 | 243 | 189 | 150 | 498 | 52 | 57 | 68 | 68 | 115 |
| 2016 | 0 | 7 | 0 | 0 | 0 | 18 | 41 | 214 | 0 | 0 | 0 | 76 |
| 2017 | 10 | 0 | 0 | 20 | 0 | 1 | 13 | 534 | 99 | 2 | 3,403 | 2,039 |
| 2018 | 0 | 130 | 0 | 0 | 0 | 0 | 0 | 0 | 0 | 0 | 0 | 0 |
| Total | 23,198 | 17,264 | 23,332 | 20,909 | 16,130 | 19,572 | 12,829 | 11,830 | 16,169 | 17,739 | 21,297 | 30,692 |
Loading, please wait
Year | Q1 | Q2 | Q3 | Q4 |
|---|---|---|---|---|
| 2008 | 44,480 | 34,632 | 19,514 | 34,761 |
| 2009 | 0 | 859 | 1,208 | 712 |
| 2010 | 1,010 | 1,683 | 1,098 | 3,719 |
| 2011 | 3,306 | 4,505 | 4,679 | 5,934 |
| 2012 | 6,372 | 6,130 | 6,104 | 9,759 |
| 2013 | 6,166 | 7,869 | 6,310 | 8,555 |
| 2014 | 1,090 | 312 | 407 | 517 |
| 2015 | 1,223 | 582 | 607 | 251 |
| 2016 | 7 | 18 | 255 | 76 |
| 2017 | 10 | 21 | 646 | 5,444 |
| 2018 | 130 | 0 | 0 | 0 |
| Total | 63,794 | 56,611 | 40,828 | 69,728 |
Loading, please wait
Year | Sales |
|---|---|
| 2018 | 130 |
| 2017 | 6,121 |
| 2016 | 356 |
| 2015 | 2,663 |
| 2014 | 2,326 |
| 2013 | 28,900 |
| 2012 | 28,365 |
| 2011 | 18,424 |
| 2010 | 7,510 |
| 2009 | 2,779 |
| 2008 | 133,387 |
| Total | 230,961 |
Download Historic Sales Data
Embedded Code
See more widgetsSources: Manufacturers