Key Stats
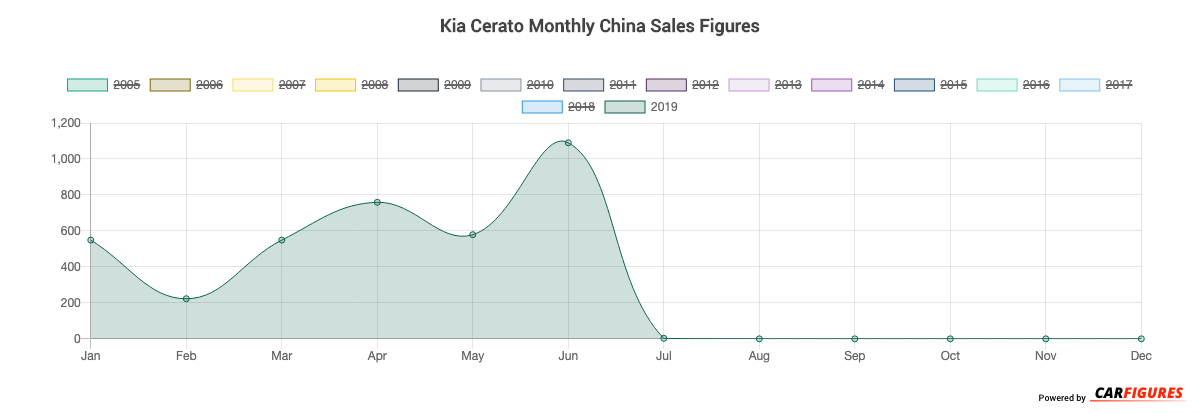
How many Cerato did Kia sell in July 2019?
Kia sold 3 Cerato in July 2019.
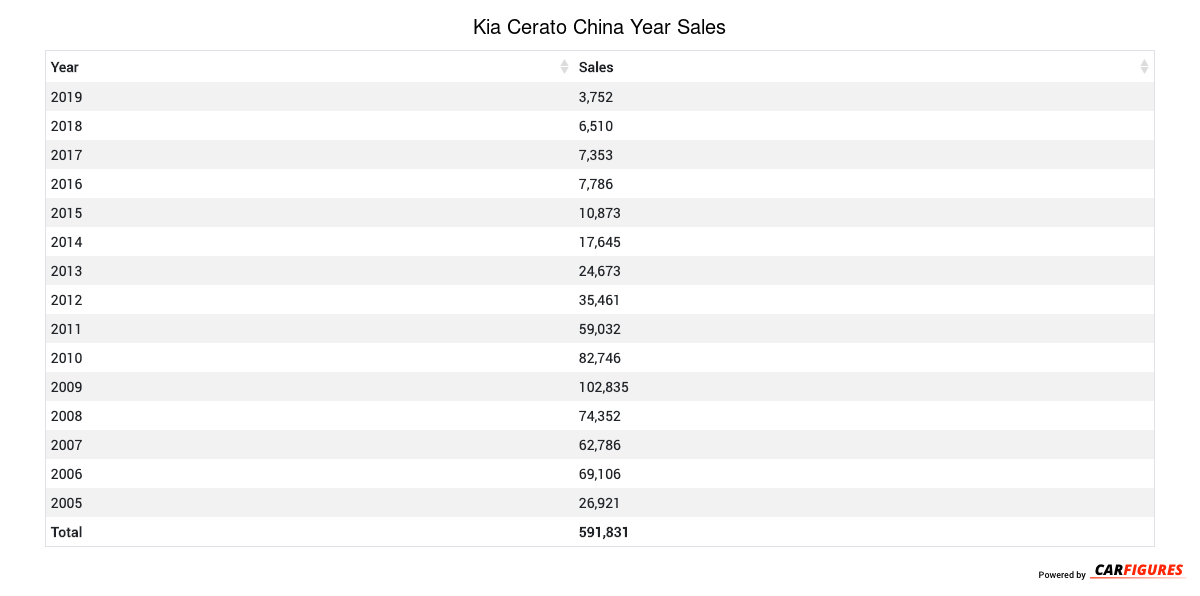
How many Cerato did Kia sell in 2019?
Kia sold 3,752 Cerato in 2019. In 2018, Kia sold 6,510 Cerato. They sold 2,758 more units in year 2018 compared to 2019 with a percent loss of 42.37% YoY.
Overview
The Cerato is a vehicle from automaker Kia.
How Much Does the Kia Cerato Cost?
The Cerato starts at CN¥89,800 Yuan ($12,572 USD) MSRP. Fully equipped, the Cerato will cost you about CN¥133,800 Yuan ($18,732 USD).
Kia Cerato Engine and Performance
Cerato is powered by a 1.6L engine that makes 82 Kw (109.96 HP) - 94 Kw (126.06 HP) and 145 Nm (107.30 ft-lb) - 161 Nm (119.14 ft-lb) torque.
Kia Cerato Specifications
The Cerato has a curb weight of 1,200 kg (2,700 lbs) - 1,300 kg (2,800 lbs).
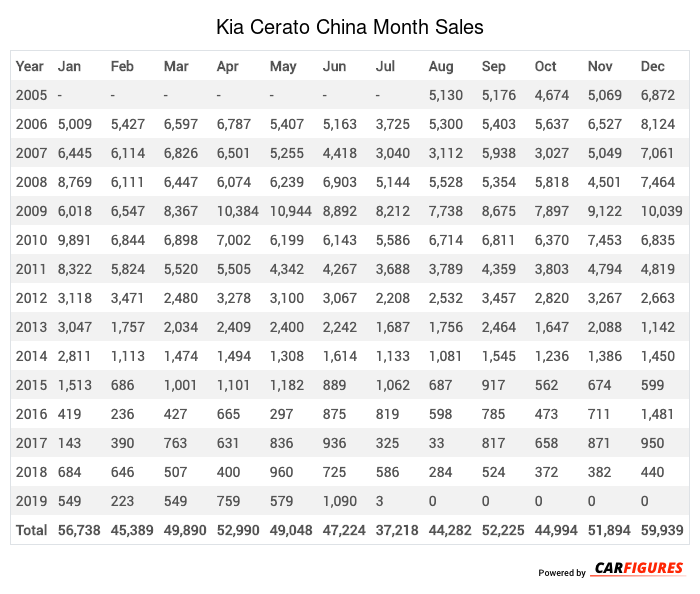
Kia Cerato China Sale figures by year, quarter, and month are presented below. Including the most up to date sales data for the Kia Cerato.
Year | Jan | Feb | Mar | Apr | May | Jun | Jul | Aug | Sep | Oct | Nov | Dec |
|---|---|---|---|---|---|---|---|---|---|---|---|---|
| 2005 | - | - | - | - | - | - | - | 5,130 | 5,176 | 4,674 | 5,069 | 6,872 |
| 2006 | 5,009 | 5,427 | 6,597 | 6,787 | 5,407 | 5,163 | 3,725 | 5,300 | 5,403 | 5,637 | 6,527 | 8,124 |
| 2007 | 6,445 | 6,114 | 6,826 | 6,501 | 5,255 | 4,418 | 3,040 | 3,112 | 5,938 | 3,027 | 5,049 | 7,061 |
| 2008 | 8,769 | 6,111 | 6,447 | 6,074 | 6,239 | 6,903 | 5,144 | 5,528 | 5,354 | 5,818 | 4,501 | 7,464 |
| 2009 | 6,018 | 6,547 | 8,367 | 10,384 | 10,944 | 8,892 | 8,212 | 7,738 | 8,675 | 7,897 | 9,122 | 10,039 |
| 2010 | 9,891 | 6,844 | 6,898 | 7,002 | 6,199 | 6,143 | 5,586 | 6,714 | 6,811 | 6,370 | 7,453 | 6,835 |
| 2011 | 8,322 | 5,824 | 5,520 | 5,505 | 4,342 | 4,267 | 3,688 | 3,789 | 4,359 | 3,803 | 4,794 | 4,819 |
| 2012 | 3,118 | 3,471 | 2,480 | 3,278 | 3,100 | 3,067 | 2,208 | 2,532 | 3,457 | 2,820 | 3,267 | 2,663 |
| 2013 | 3,047 | 1,757 | 2,034 | 2,409 | 2,400 | 2,242 | 1,687 | 1,756 | 2,464 | 1,647 | 2,088 | 1,142 |
| 2014 | 2,811 | 1,113 | 1,474 | 1,494 | 1,308 | 1,614 | 1,133 | 1,081 | 1,545 | 1,236 | 1,386 | 1,450 |
| 2015 | 1,513 | 686 | 1,001 | 1,101 | 1,182 | 889 | 1,062 | 687 | 917 | 562 | 674 | 599 |
| 2016 | 419 | 236 | 427 | 665 | 297 | 875 | 819 | 598 | 785 | 473 | 711 | 1,481 |
| 2017 | 143 | 390 | 763 | 631 | 836 | 936 | 325 | 33 | 817 | 658 | 871 | 950 |
| 2018 | 684 | 646 | 507 | 400 | 960 | 725 | 586 | 284 | 524 | 372 | 382 | 440 |
| 2019 | 549 | 223 | 549 | 759 | 579 | 1,090 | 3 | 0 | 0 | 0 | 0 | 0 |
| Total | 56,738 | 45,389 | 49,890 | 52,990 | 49,048 | 47,224 | 37,218 | 44,282 | 52,225 | 44,994 | 51,894 | 59,939 |
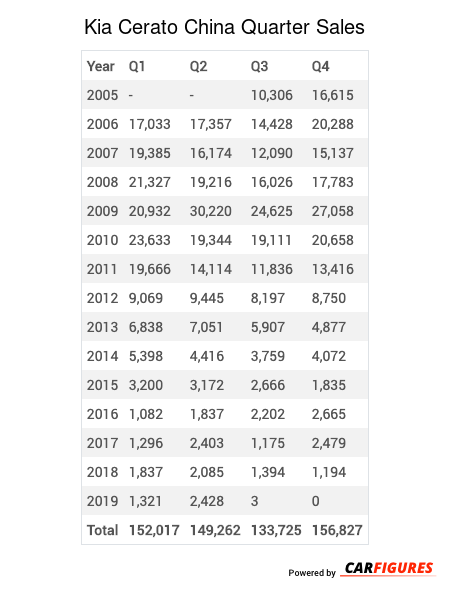
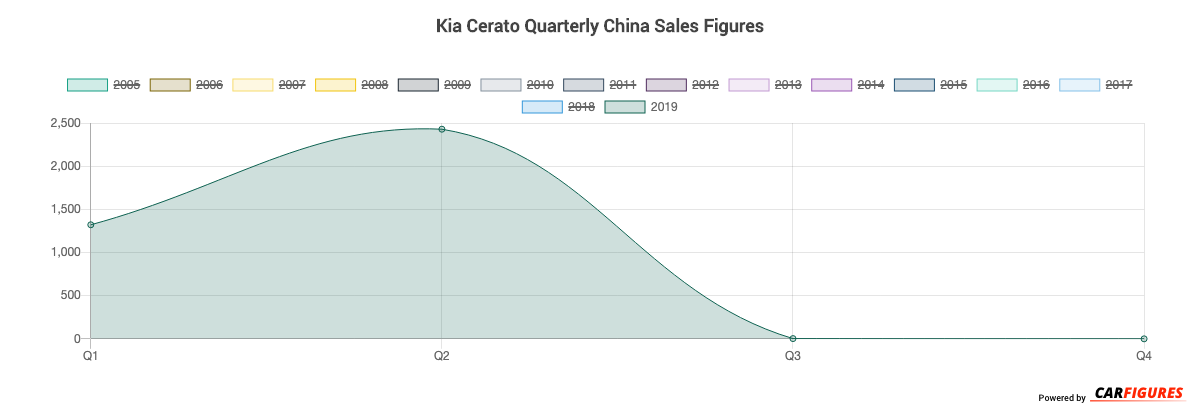
Year | Q1 | Q2 | Q3 | Q4 |
|---|---|---|---|---|
| 2005 | - | - | 10,306 | 16,615 |
| 2006 | 17,033 | 17,357 | 14,428 | 20,288 |
| 2007 | 19,385 | 16,174 | 12,090 | 15,137 |
| 2008 | 21,327 | 19,216 | 16,026 | 17,783 |
| 2009 | 20,932 | 30,220 | 24,625 | 27,058 |
| 2010 | 23,633 | 19,344 | 19,111 | 20,658 |
| 2011 | 19,666 | 14,114 | 11,836 | 13,416 |
| 2012 | 9,069 | 9,445 | 8,197 | 8,750 |
| 2013 | 6,838 | 7,051 | 5,907 | 4,877 |
| 2014 | 5,398 | 4,416 | 3,759 | 4,072 |
| 2015 | 3,200 | 3,172 | 2,666 | 1,835 |
| 2016 | 1,082 | 1,837 | 2,202 | 2,665 |
| 2017 | 1,296 | 2,403 | 1,175 | 2,479 |
| 2018 | 1,837 | 2,085 | 1,394 | 1,194 |
| 2019 | 1,321 | 2,428 | 3 | 0 |
| Total | 152,017 | 149,262 | 133,725 | 156,827 |
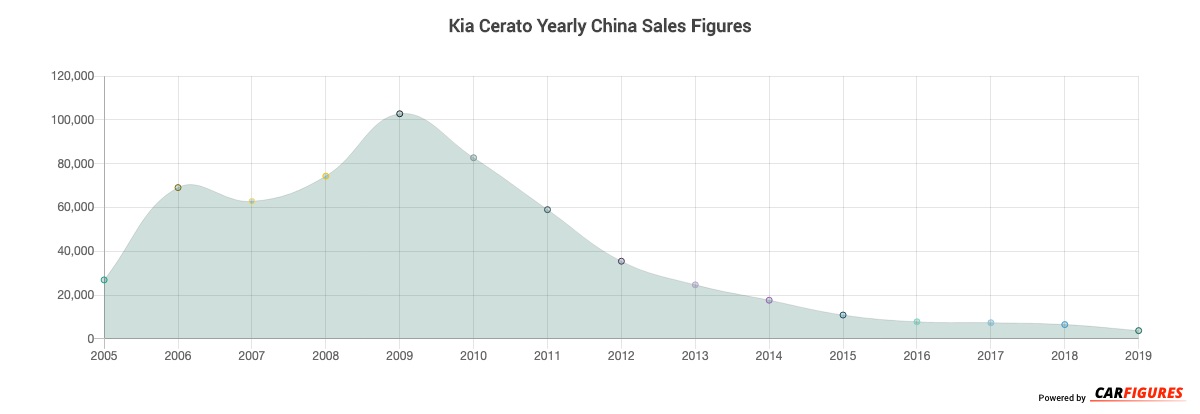
Year | Sales |
|---|---|
| 2019 | 3,752 |
| 2018 | 6,510 |
| 2017 | 7,353 |
| 2016 | 7,786 |
| 2015 | 10,873 |
| 2014 | 17,645 |
| 2013 | 24,673 |
| 2012 | 35,461 |
| 2011 | 59,032 |
| 2010 | 82,746 |
| 2009 | 102,835 |
| 2008 | 74,352 |
| 2007 | 62,786 |
| 2006 | 69,106 |
| 2005 | 26,921 |
| Total | 591,831 |
Download Historic Sales Data
Embedded Code
See more widgetsSources: Manufacturers