Last updated: May 15, 2020
Key Stats
How many Spirior did Honda sell in August 2018?
Honda sold 1,171 Spirior in August 2018.
Overview
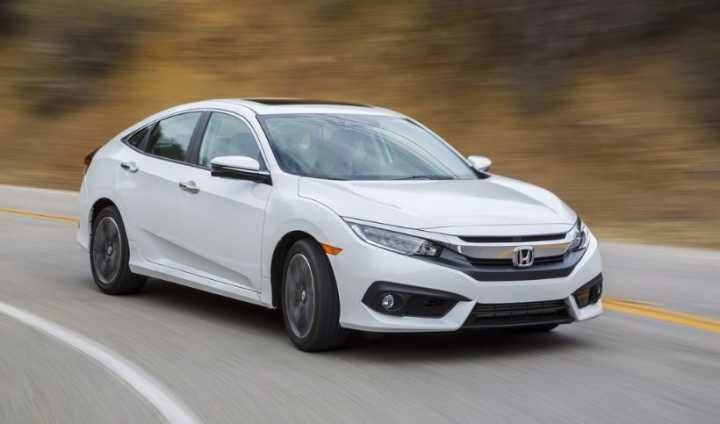
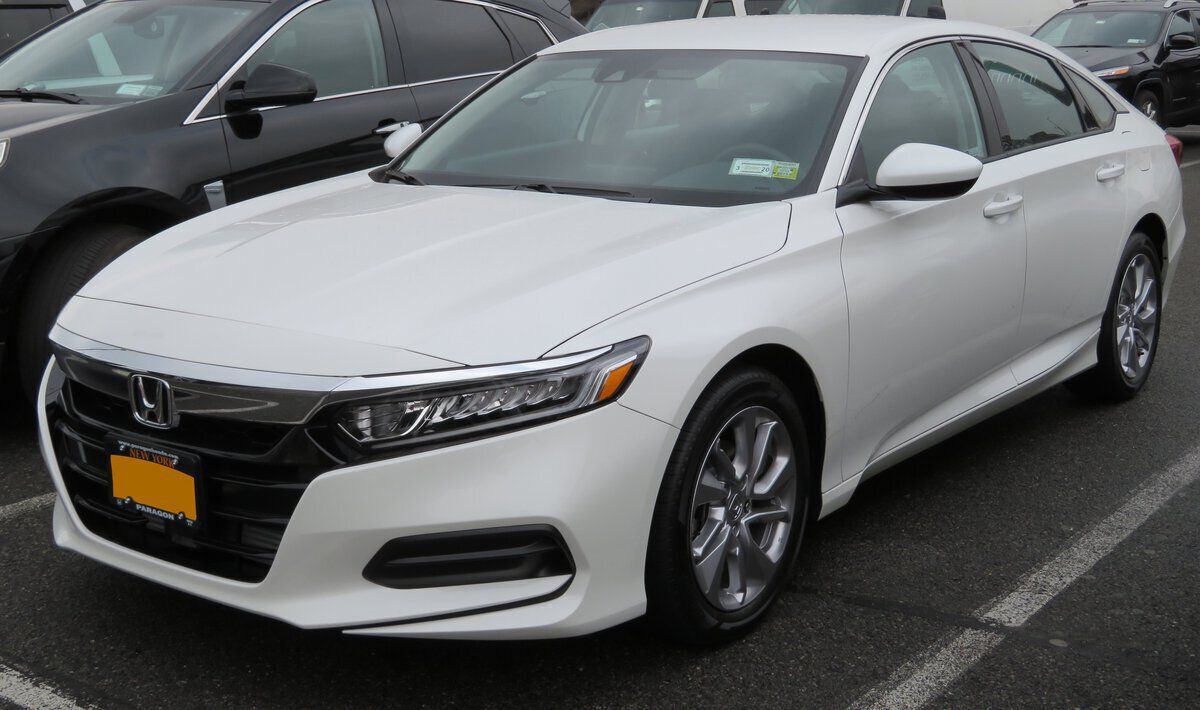
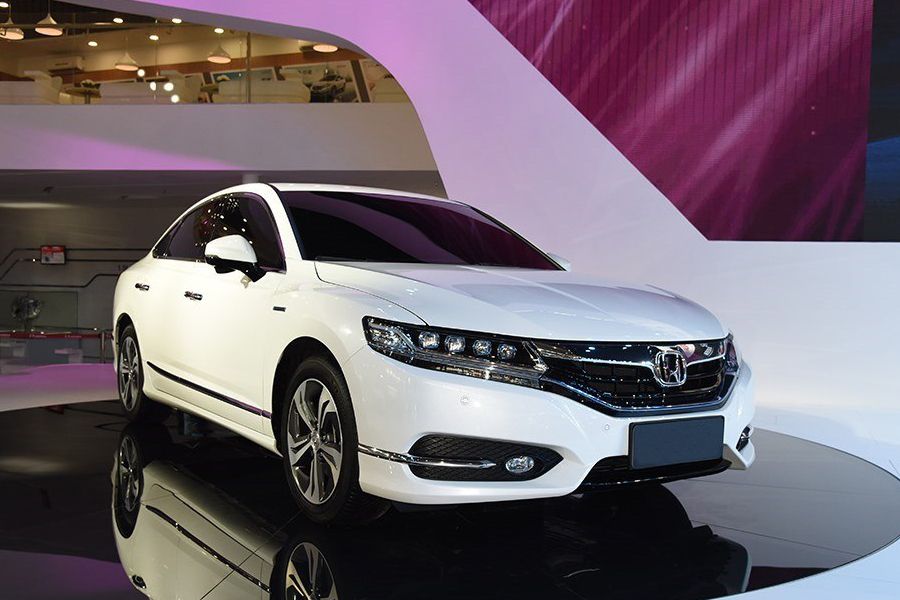
The Spirior is a 4-door 5-seater sedan with room for 5 people from automaker Honda.
How Much Does the Honda Spirior Cost?
Pricing for the Spirior starts at CN¥179,800 Yuan ($25,172 USD) MSRP and goes up to CN¥267,900 Yuan ($37,506 USD) fully equipped.
Honda Spirior Engine and Performance
The Spirior includes a 2.0LL that delivers 107 Kw (143.49 HP) - 153 Kw (205.18 HP) and 175 Nm (129.50 ft-lb) - 247 Nm (182.78 ft-lb) torque.
Honda Spirior Specifications
The Spirior has a curb weight of 1,500 kg (3,300 lbs) - 1,600 kg (3,600 lbs).
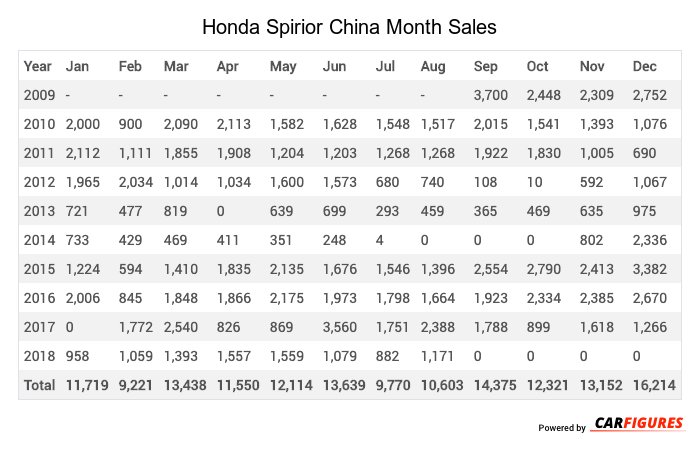
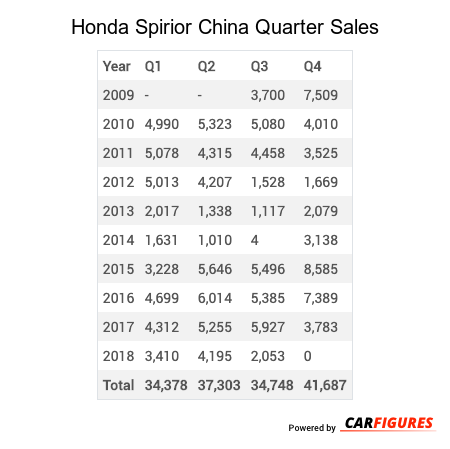
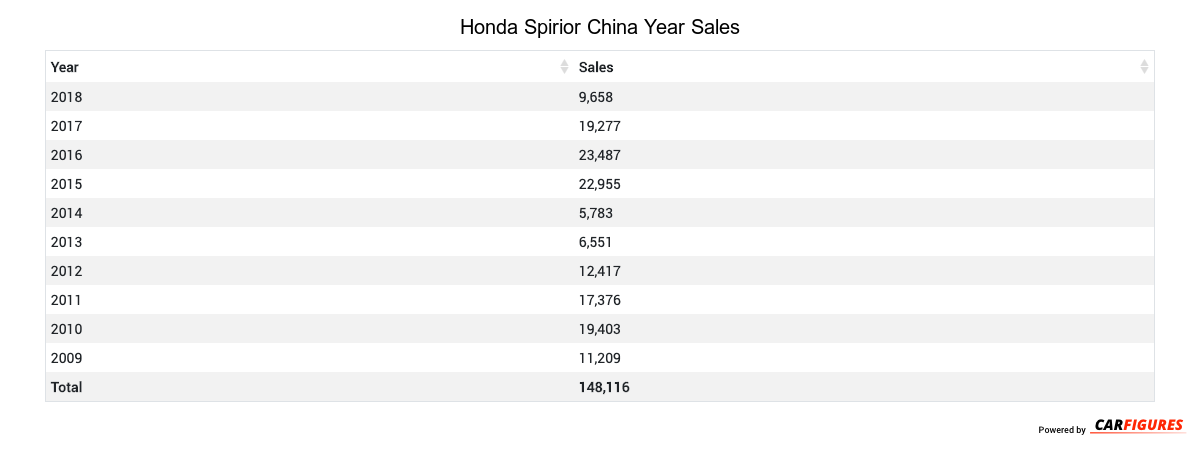
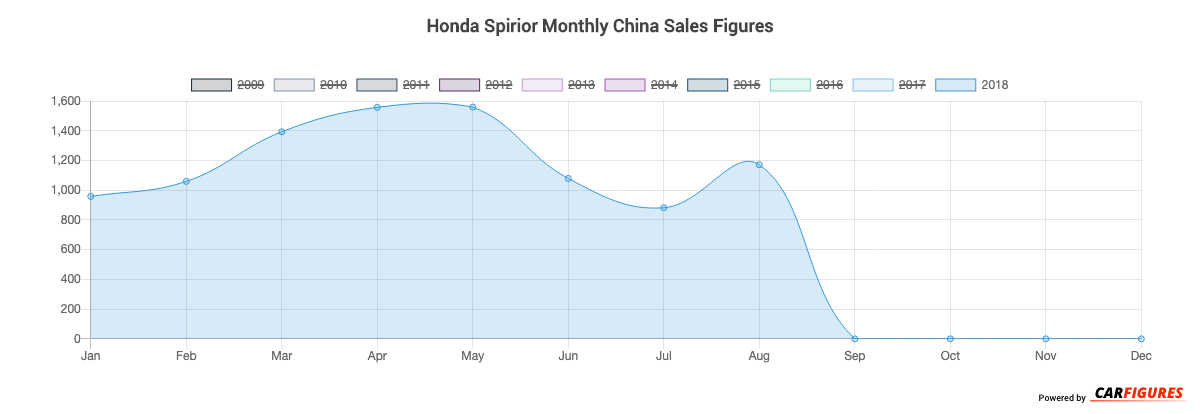
Honda Spirior China Sale figures by year, quarter, and month are presented below. Including the most up to date sales data for the Honda Spirior.
Loading, please wait
Year | Jan | Feb | Mar | Apr | May | Jun | Jul | Aug | Sep | Oct | Nov | Dec |
|---|---|---|---|---|---|---|---|---|---|---|---|---|
| 2009 | - | - | - | - | - | - | - | - | 3,700 | 2,448 | 2,309 | 2,752 |
| 2010 | 2,000 | 900 | 2,090 | 2,113 | 1,582 | 1,628 | 1,548 | 1,517 | 2,015 | 1,541 | 1,393 | 1,076 |
| 2011 | 2,112 | 1,111 | 1,855 | 1,908 | 1,204 | 1,203 | 1,268 | 1,268 | 1,922 | 1,830 | 1,005 | 690 |
| 2012 | 1,965 | 2,034 | 1,014 | 1,034 | 1,600 | 1,573 | 680 | 740 | 108 | 10 | 592 | 1,067 |
| 2013 | 721 | 477 | 819 | 0 | 639 | 699 | 293 | 459 | 365 | 469 | 635 | 975 |
| 2014 | 733 | 429 | 469 | 411 | 351 | 248 | 4 | 0 | 0 | 0 | 802 | 2,336 |
| 2015 | 1,224 | 594 | 1,410 | 1,835 | 2,135 | 1,676 | 1,546 | 1,396 | 2,554 | 2,790 | 2,413 | 3,382 |
| 2016 | 2,006 | 845 | 1,848 | 1,866 | 2,175 | 1,973 | 1,798 | 1,664 | 1,923 | 2,334 | 2,385 | 2,670 |
| 2017 | 0 | 1,772 | 2,540 | 826 | 869 | 3,560 | 1,751 | 2,388 | 1,788 | 899 | 1,618 | 1,266 |
| 2018 | 958 | 1,059 | 1,393 | 1,557 | 1,559 | 1,079 | 882 | 1,171 | 0 | 0 | 0 | 0 |
| Total | 11,719 | 9,221 | 13,438 | 11,550 | 12,114 | 13,639 | 9,770 | 10,603 | 14,375 | 12,321 | 13,152 | 16,214 |
Loading, please wait
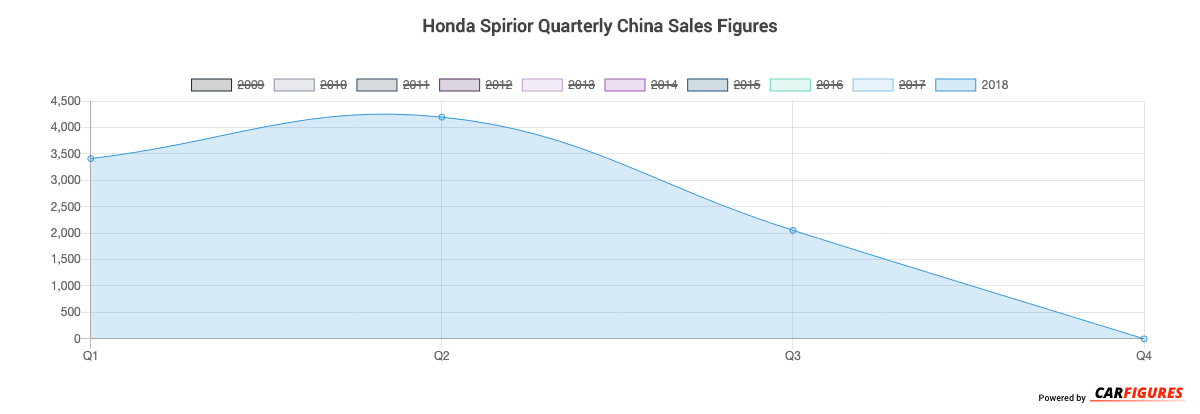
Year | Q1 | Q2 | Q3 | Q4 |
|---|---|---|---|---|
| 2009 | - | - | 3,700 | 7,509 |
| 2010 | 4,990 | 5,323 | 5,080 | 4,010 |
| 2011 | 5,078 | 4,315 | 4,458 | 3,525 |
| 2012 | 5,013 | 4,207 | 1,528 | 1,669 |
| 2013 | 2,017 | 1,338 | 1,117 | 2,079 |
| 2014 | 1,631 | 1,010 | 4 | 3,138 |
| 2015 | 3,228 | 5,646 | 5,496 | 8,585 |
| 2016 | 4,699 | 6,014 | 5,385 | 7,389 |
| 2017 | 4,312 | 5,255 | 5,927 | 3,783 |
| 2018 | 3,410 | 4,195 | 2,053 | 0 |
| Total | 34,378 | 37,303 | 34,748 | 41,687 |
Loading, please wait
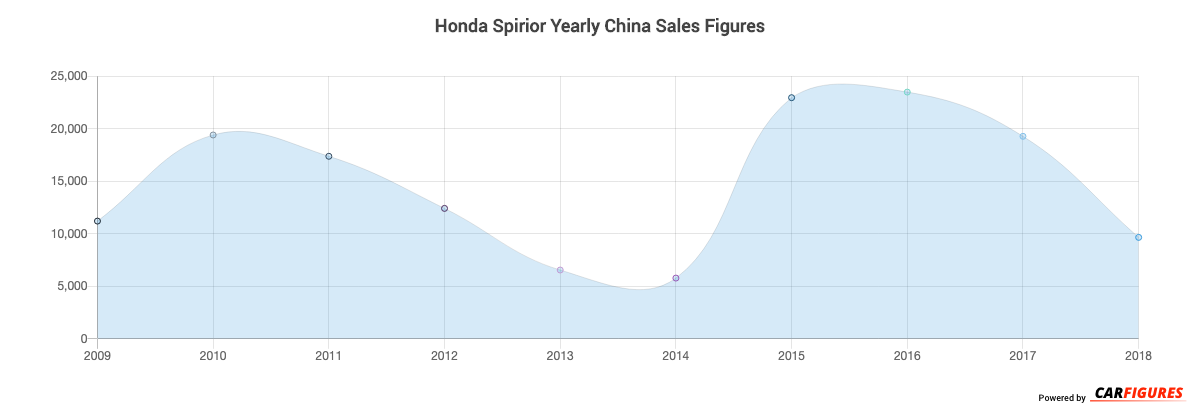
Year | Sales |
|---|---|
| 2018 | 9,658 |
| 2017 | 19,277 |
| 2016 | 23,487 |
| 2015 | 22,955 |
| 2014 | 5,783 |
| 2013 | 6,551 |
| 2012 | 12,417 |
| 2011 | 17,376 |
| 2010 | 19,403 |
| 2009 | 11,209 |
| Total | 148,116 |
Download Historic Sales Data
Embedded Code
See more widgetsSources: Manufacturers