Key Stats
How many Ecosport did Ford sell in 2020?
Ford sold 2,670 Ecosport in 2020. (From Jan - Dec 2020)
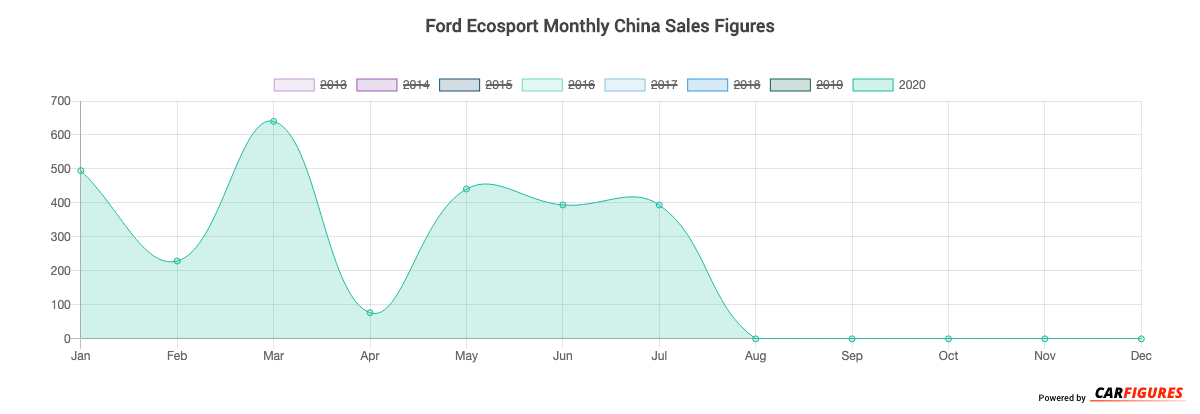
How many Ecosport did Ford sell in July 2020?
Ford sold 394 Ecosport in July 2020.
How many Ecosport did Ford sell in 2019?
Ford sold 2,924 Ecosport in 2019. In 2018, Ford sold 16,033 Ecosport. They sold 13,109 more units in year 2018 compared to 2019 with a percent loss of 81.76% YoY.
Overview
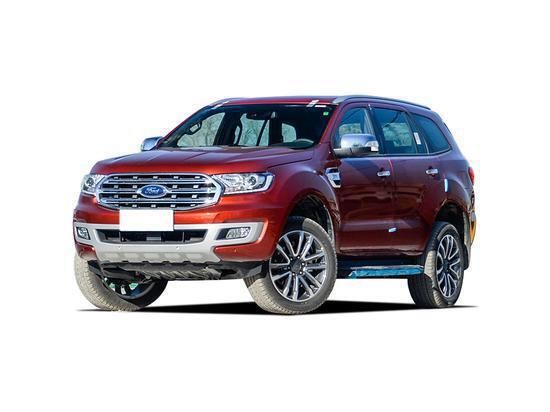
The Ecosport is a 5 doors 5 seats SUV with room for 5 people from automaker Ford.
How Much Does the Ford Ecosport Cost?
Pricing for the Ecosport starts at CN¥79,800 Yuan ($11,172 USD) MSRP and goes up to CN¥155,800 Yuan ($21,812 USD) fully equipped.
Ford Ecosport Engine and Performance
Ecosport includes a 1.5LL engine. This delivers 88 Kw (118.01 HP) - 125 Kw (167.63 HP) and 150 Nm (111.00 ft-lb) - 202 Nm (149.48 ft-lb) torque.
Ford Ecosport Specifications
The Ecosport has a curb weight of 1,200 kg (2,700 lbs) - 1,300 kg (2,900 lbs).
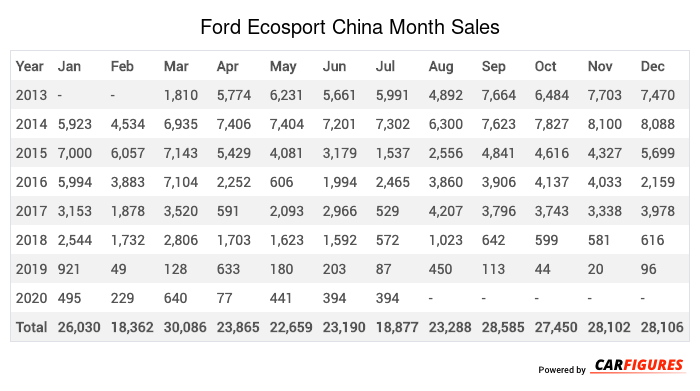
Ford Ecosport China Sale figures by year, quarter, and month are presented below. Including the most up to date sales data for the Ford Ecosport.
Year | Jan | Feb | Mar | Apr | May | Jun | Jul | Aug | Sep | Oct | Nov | Dec |
|---|---|---|---|---|---|---|---|---|---|---|---|---|
| 2013 | - | - | 1,810 | 5,774 | 6,231 | 5,661 | 5,991 | 4,892 | 7,664 | 6,484 | 7,703 | 7,470 |
| 2014 | 5,923 | 4,534 | 6,935 | 7,406 | 7,404 | 7,201 | 7,302 | 6,300 | 7,623 | 7,827 | 8,100 | 8,088 |
| 2015 | 7,000 | 6,057 | 7,143 | 5,429 | 4,081 | 3,179 | 1,537 | 2,556 | 4,841 | 4,616 | 4,327 | 5,699 |
| 2016 | 5,994 | 3,883 | 7,104 | 2,252 | 606 | 1,994 | 2,465 | 3,860 | 3,906 | 4,137 | 4,033 | 2,159 |
| 2017 | 3,153 | 1,878 | 3,520 | 591 | 2,093 | 2,966 | 529 | 4,207 | 3,796 | 3,743 | 3,338 | 3,978 |
| 2018 | 2,544 | 1,732 | 2,806 | 1,703 | 1,623 | 1,592 | 572 | 1,023 | 642 | 599 | 581 | 616 |
| 2019 | 921 | 49 | 128 | 633 | 180 | 203 | 87 | 450 | 113 | 44 | 20 | 96 |
| 2020 | 495 | 229 | 640 | 77 | 441 | 394 | 394 | - | - | - | - | - |
| Total | 26,030 | 18,362 | 30,086 | 23,865 | 22,659 | 23,190 | 18,877 | 23,288 | 28,585 | 27,450 | 28,102 | 28,106 |
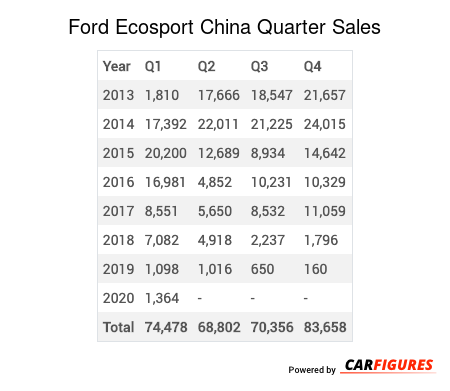
Year | Q1 | Q2 | Q3 | Q4 |
|---|---|---|---|---|
| 2013 | 1,810 | 17,666 | 18,547 | 21,657 |
| 2014 | 17,392 | 22,011 | 21,225 | 24,015 |
| 2015 | 20,200 | 12,689 | 8,934 | 14,642 |
| 2016 | 16,981 | 4,852 | 10,231 | 10,329 |
| 2017 | 8,551 | 5,650 | 8,532 | 11,059 |
| 2018 | 7,082 | 4,918 | 2,237 | 1,796 |
| 2019 | 1,098 | 1,016 | 650 | 160 |
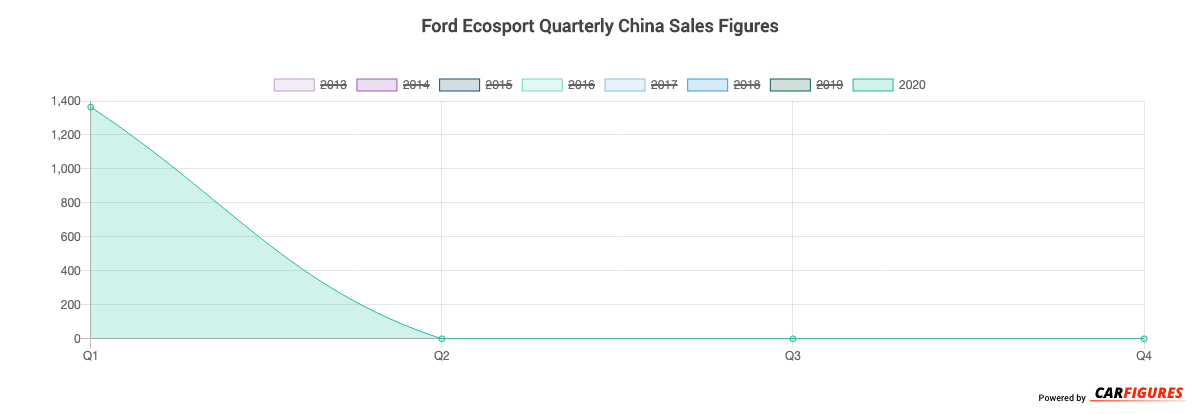
| 2020 | 1,364 | - | - | - |
| Total | 74,478 | 68,802 | 70,356 | 83,658 |
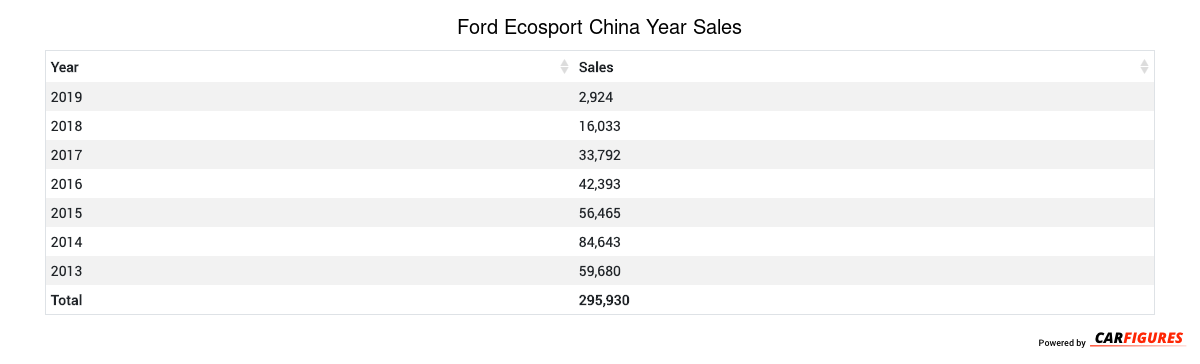
Year | Sales |
|---|---|
| 2020 | 1,364 |
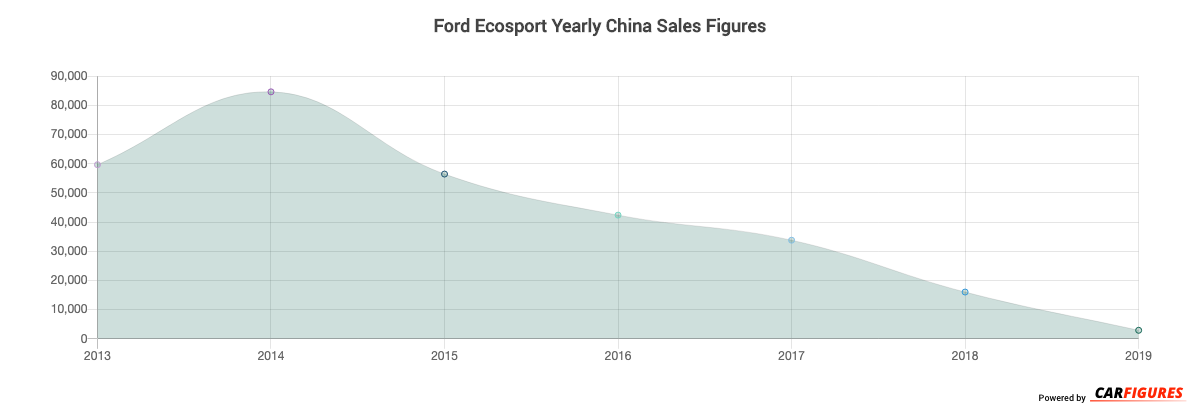
| 2019 | 2,924 |
| 2018 | 16,033 |
| 2017 | 33,792 |
| 2016 | 42,393 |
| 2015 | 56,465 |
| 2014 | 84,643 |
| 2013 | 59,680 |
| Total | 297,294 |
Download Historic Sales Data
Embedded Code
See more widgetsSources: Manufacturers