Key Stats
How many C4L did Citroen sell in 2020?
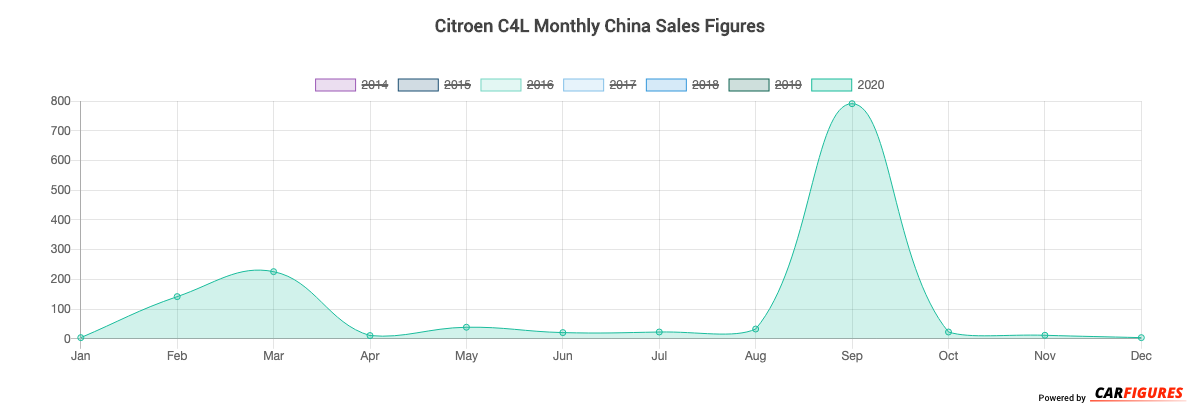
Citroen sold 1,329 C4L in 2020. (From Jan - Dec 2020)
How many C4L did Citroen sell in December 2020?
Citroen sold 4 C4L in December 2020.
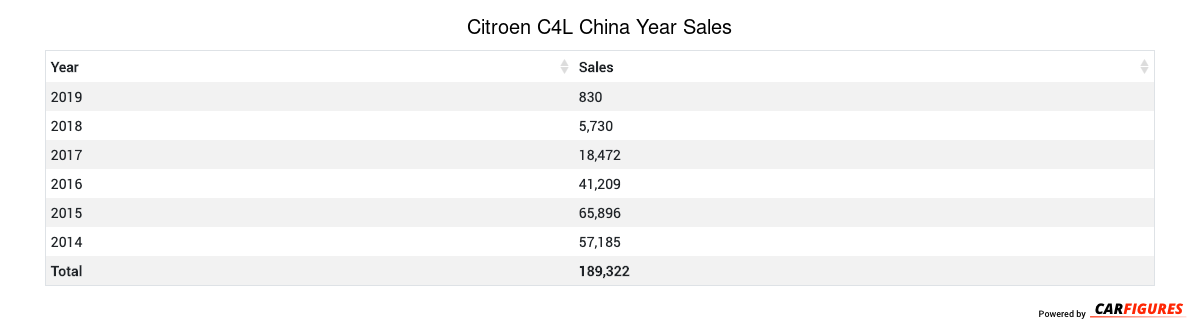
How many C4L did Citroen sell in 2019?
Citroen sold 830 C4L in 2019. In 2018, Citroen sold 5,730 C4L. They sold 4,900 more units in year 2018 compared to 2019 with a percent loss of 85.51% YoY.
Overview
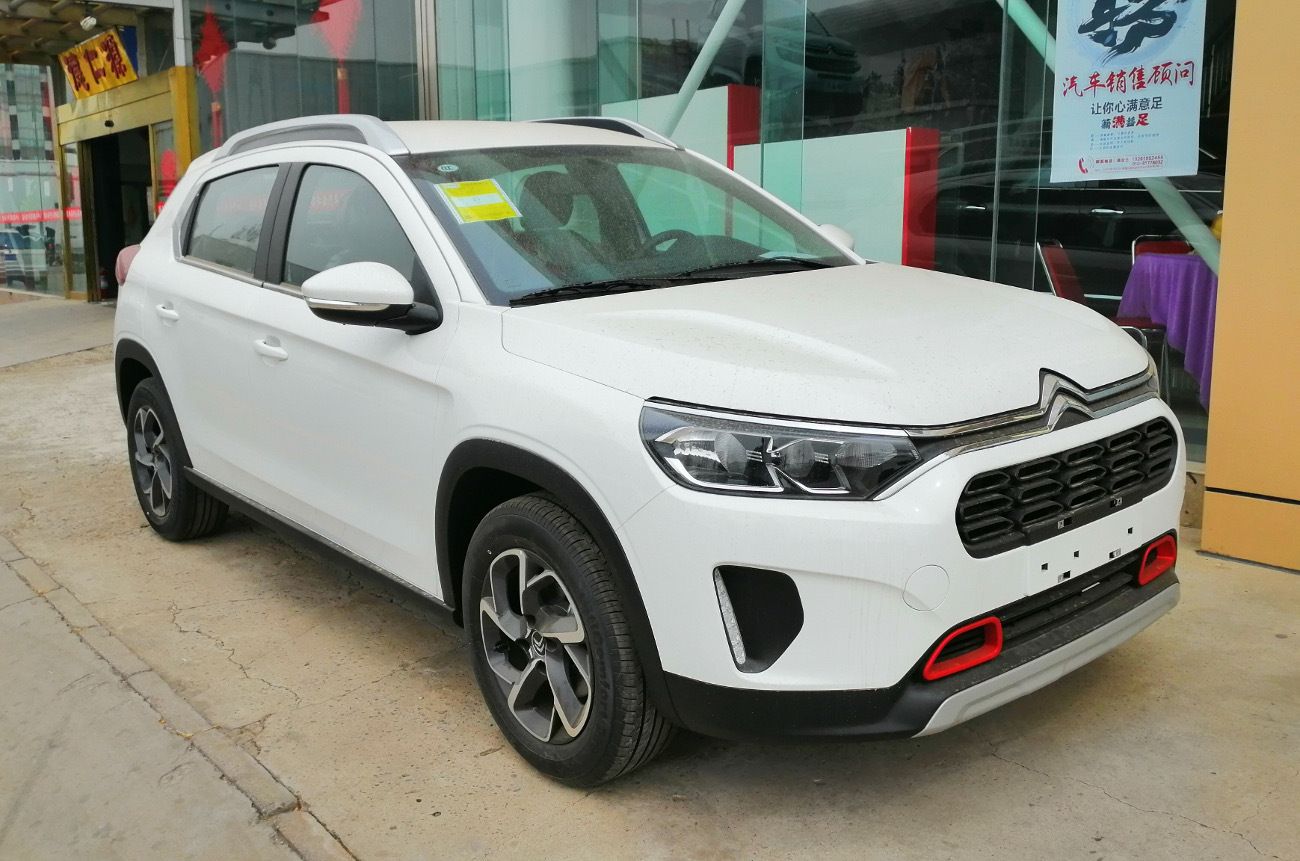
The C4L is a 4-door 5-seater sedan with room for 5 people.
How Much Does the Citroen C4L Cost?
The C4L starts at CN¥106,900 Yuan ($14,966 USD) MSRP. Fully equipped, the C4L will cost you about CN¥141,900 Yuan ($19,866 USD).
Citroen C4L Engine and Performance
The C4L includes a 1.2TL that delivers 100 Kw (134.10 HP) - 123 Kw (164.95 HP) and 230 Nm (170.20 ft-lb) - 245 Nm (181.30 ft-lb) torque.
Citroen C4L Specifications
The C4L has a curb weight of 1,300 kg (2,900 lbs) - 1,400 kg (3,100 lbs).
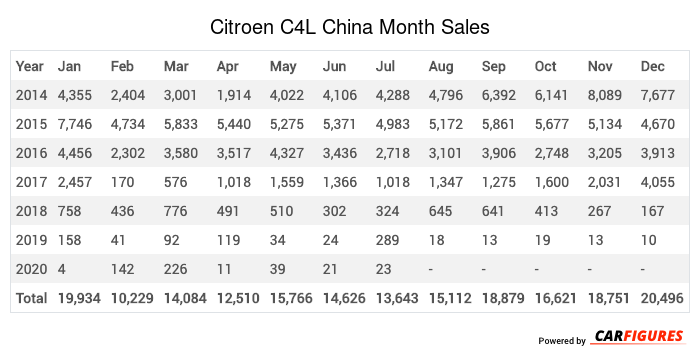
Citroen C4L China Sale figures by year, quarter, and month are presented below. Including the most up to date sales data for the Citroen C4L.
Year | Jan | Feb | Mar | Apr | May | Jun | Jul | Aug | Sep | Oct | Nov | Dec |
|---|---|---|---|---|---|---|---|---|---|---|---|---|
| 2014 | 4,355 | 2,404 | 3,001 | 1,914 | 4,022 | 4,106 | 4,288 | 4,796 | 6,392 | 6,141 | 8,089 | 7,677 |
| 2015 | 7,746 | 4,734 | 5,833 | 5,440 | 5,275 | 5,371 | 4,983 | 5,172 | 5,861 | 5,677 | 5,134 | 4,670 |
| 2016 | 4,456 | 2,302 | 3,580 | 3,517 | 4,327 | 3,436 | 2,718 | 3,101 | 3,906 | 2,748 | 3,205 | 3,913 |
| 2017 | 2,457 | 170 | 576 | 1,018 | 1,559 | 1,366 | 1,018 | 1,347 | 1,275 | 1,600 | 2,031 | 4,055 |
| 2018 | 758 | 436 | 776 | 491 | 510 | 302 | 324 | 645 | 641 | 413 | 267 | 167 |
| 2019 | 158 | 41 | 92 | 119 | 34 | 24 | 289 | 18 | 13 | 19 | 13 | 10 |
| 2020 | 4 | 142 | 226 | 11 | 39 | 21 | 23 | 33 | 791 | 23 | 12 | 4 |
| Total | 19,934 | 10,229 | 14,084 | 12,510 | 15,766 | 14,626 | 13,643 | 15,112 | 18,879 | 16,621 | 18,751 | 20,496 |
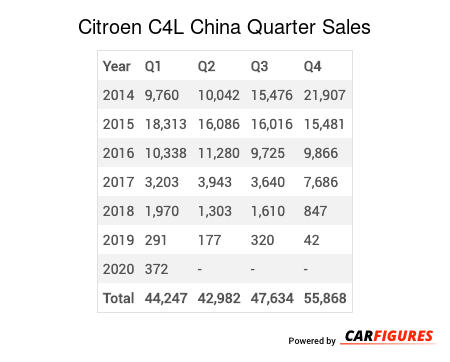
Year | Q1 | Q2 | Q3 | Q4 |
|---|---|---|---|---|
| 2014 | 9,760 | 10,042 | 15,476 | 21,907 |
| 2015 | 18,313 | 16,086 | 16,016 | 15,481 |
| 2016 | 10,338 | 11,280 | 9,725 | 9,866 |
| 2017 | 3,203 | 3,943 | 3,640 | 7,686 |
| 2018 | 1,970 | 1,303 | 1,610 | 847 |
| 2019 | 291 | 177 | 320 | 42 |
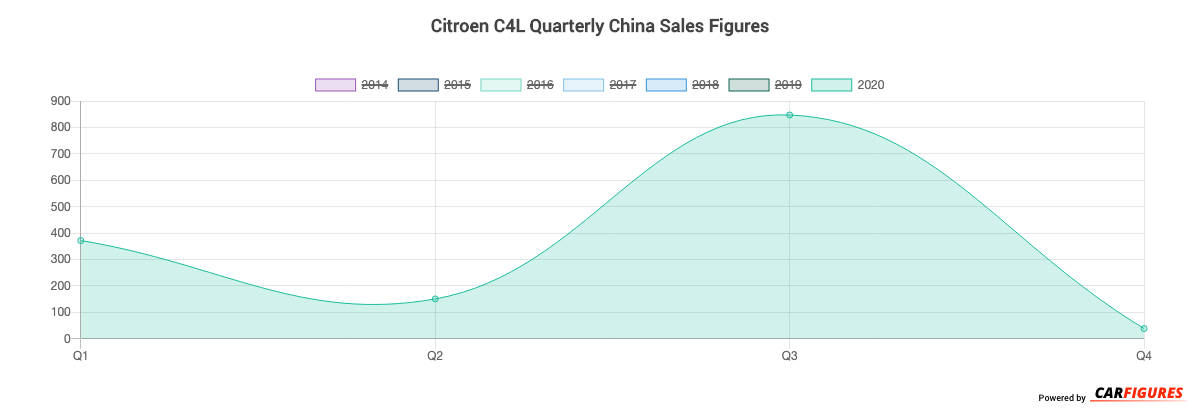
| 2020 | 372 | 151 | 847 | 39 |
| Total | 44,247 | 42,982 | 47,634 | 55,868 |
Year | Sales |
|---|---|
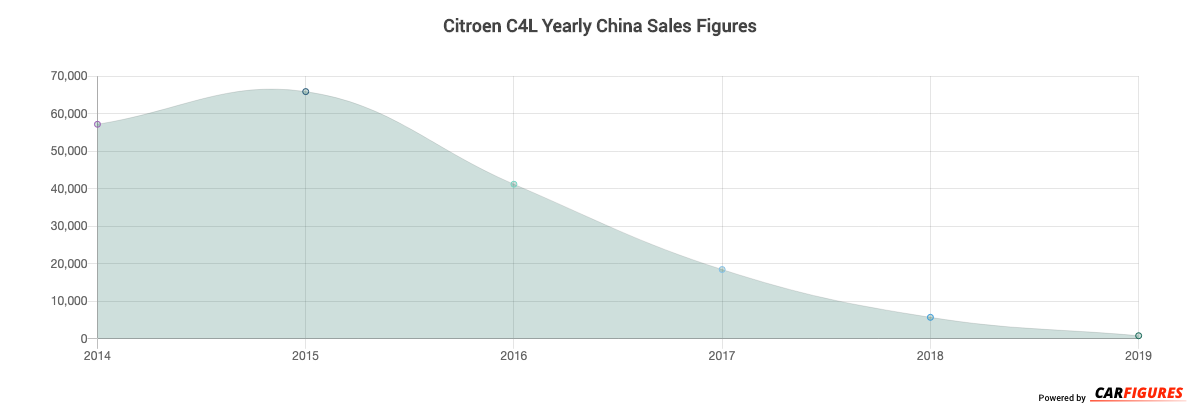
| 2020 | 1,409 |
| 2019 | 830 |
| 2018 | 5,730 |
| 2017 | 18,472 |
| 2016 | 41,209 |
| 2015 | 65,896 |
| 2014 | 57,185 |
| Total | 190,731 |
Download Historic Sales Data
Embedded Code
See more widgetsSources: Manufacturers