Key Stats
How many C3-XR did Citroen sell in 2020?
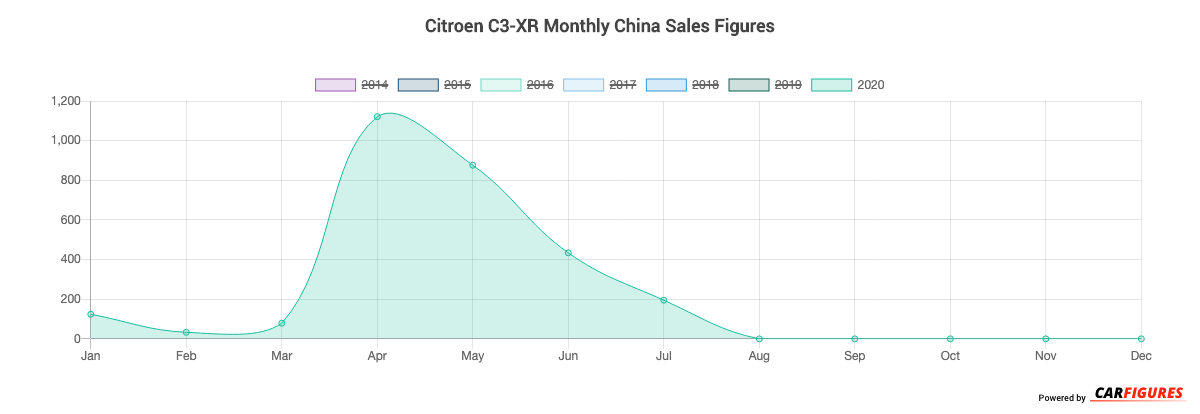
Citroen sold 2,862 C3-XR in 2020. (From Jan - Dec 2020)
How many C3-XR did Citroen sell in July 2020?
Citroen sold 195 C3-XR in July 2020.
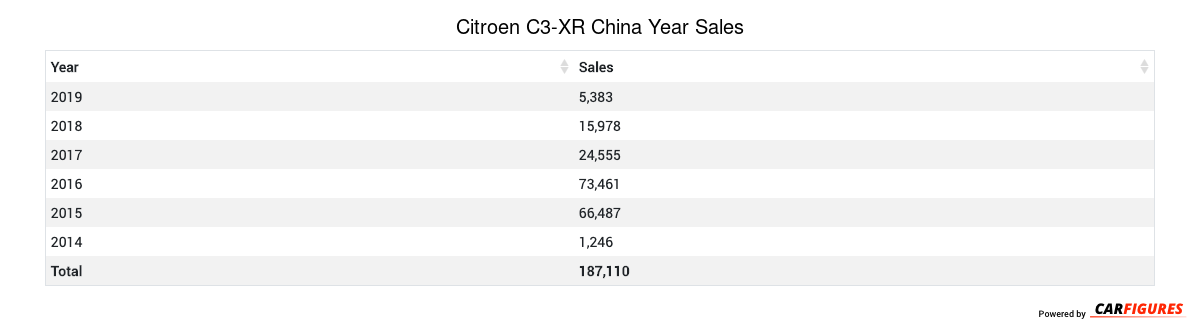
How many C3-XR did Citroen sell in 2019?
Citroen sold 5,383 C3-XR in 2019. In 2018, Citroen sold 15,978 C3-XR. They sold 10,595 more units in year 2018 compared to 2019 with a percent loss of 66.31% YoY.
Overview
The C3-XR is a 5 doors 5 seats SUV with room for 5 people from automaker Citroen.
How Much Does the Citroen C3-XR Cost?
Pricing for the C3-XR starts at CN¥94,800 Yuan ($13,272 USD) MSRP and goes up to CN¥117,900 Yuan ($16,506 USD) fully equipped.
Citroen C3-XR Engine and Performance
C3-XR includes a 1.6LL engine. This delivers 85 Kw (113.99 HP) - 100 Kw (134.10 HP) and 150 Nm (111.00 ft-lb) - 230 Nm (170.20 ft-lb) torque.
Citroen C3-XR Specifications
The C3-XR has a curb weight of 1,200 kg (2,700 lbs) - 1,300 kg (2,800 lbs).
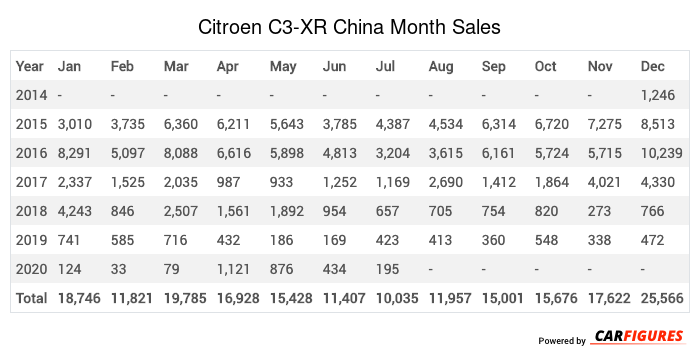
Citroen C3-XR China Sale figures by year, quarter, and month are presented below. Including the most up to date sales data for the Citroen C3-XR.
Year | Jan | Feb | Mar | Apr | May | Jun | Jul | Aug | Sep | Oct | Nov | Dec |
|---|---|---|---|---|---|---|---|---|---|---|---|---|
| 2014 | - | - | - | - | - | - | - | - | - | - | - | 1,246 |
| 2015 | 3,010 | 3,735 | 6,360 | 6,211 | 5,643 | 3,785 | 4,387 | 4,534 | 6,314 | 6,720 | 7,275 | 8,513 |
| 2016 | 8,291 | 5,097 | 8,088 | 6,616 | 5,898 | 4,813 | 3,204 | 3,615 | 6,161 | 5,724 | 5,715 | 10,239 |
| 2017 | 2,337 | 1,525 | 2,035 | 987 | 933 | 1,252 | 1,169 | 2,690 | 1,412 | 1,864 | 4,021 | 4,330 |
| 2018 | 4,243 | 846 | 2,507 | 1,561 | 1,892 | 954 | 657 | 705 | 754 | 820 | 273 | 766 |
| 2019 | 741 | 585 | 716 | 432 | 186 | 169 | 423 | 413 | 360 | 548 | 338 | 472 |
| 2020 | 124 | 33 | 79 | 1,121 | 876 | 434 | 195 | - | - | - | - | - |
| Total | 18,746 | 11,821 | 19,785 | 16,928 | 15,428 | 11,407 | 10,035 | 11,957 | 15,001 | 15,676 | 17,622 | 25,566 |
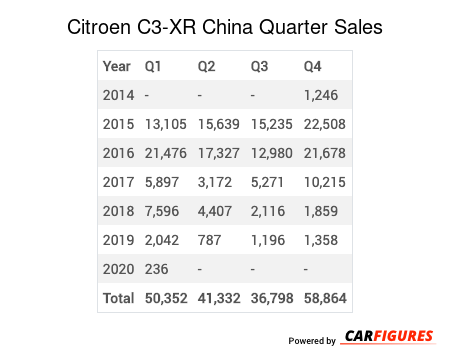
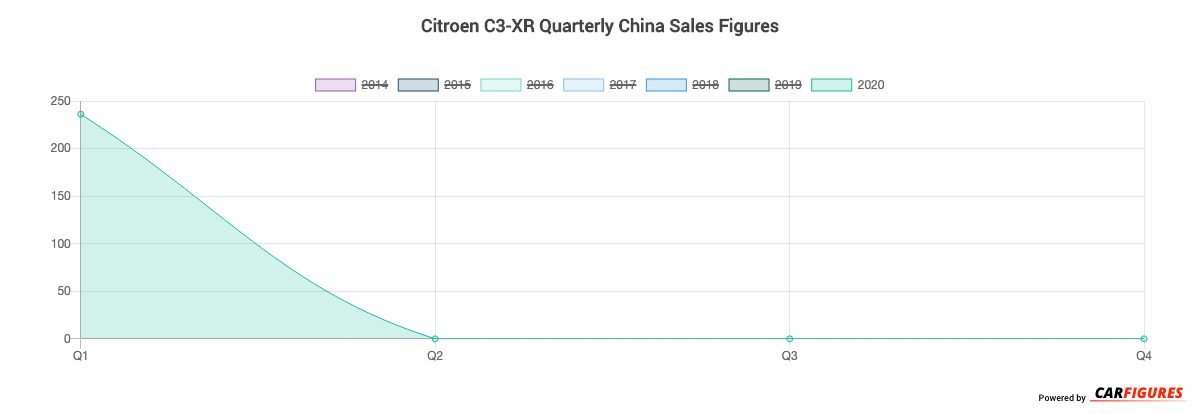
Year | Q1 | Q2 | Q3 | Q4 |
|---|---|---|---|---|
| 2014 | - | - | - | 1,246 |
| 2015 | 13,105 | 15,639 | 15,235 | 22,508 |
| 2016 | 21,476 | 17,327 | 12,980 | 21,678 |
| 2017 | 5,897 | 3,172 | 5,271 | 10,215 |
| 2018 | 7,596 | 4,407 | 2,116 | 1,859 |
| 2019 | 2,042 | 787 | 1,196 | 1,358 |
| 2020 | 236 | - | - | - |
| Total | 50,352 | 41,332 | 36,798 | 58,864 |
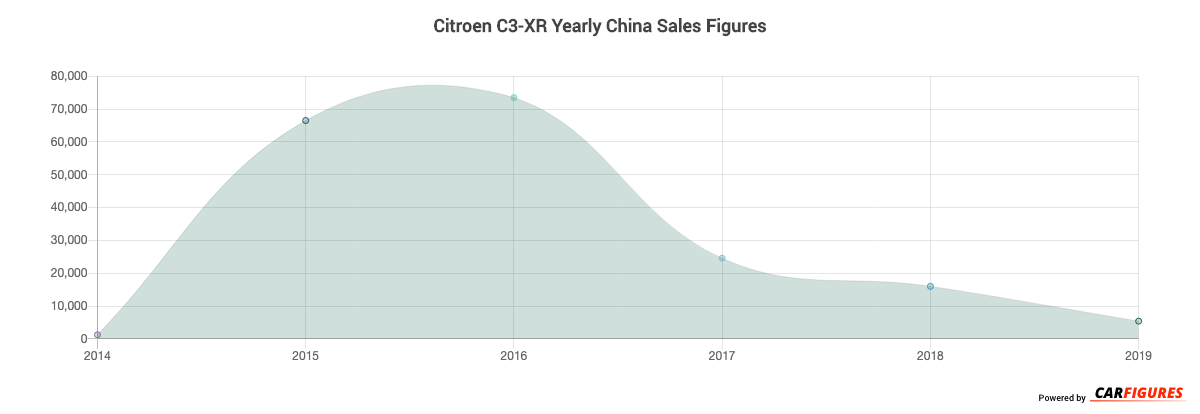
Year | Sales |
|---|---|
| 2020 | 236 |
| 2019 | 5,383 |
| 2018 | 15,978 |
| 2017 | 24,555 |
| 2016 | 73,461 |
| 2015 | 66,487 |
| 2014 | 1,246 |
| Total | 187,346 |
Download Historic Sales Data
Embedded Code
See more widgetsSources: Manufacturers