Key Stats
How many Tang did BYD sell in 2020?
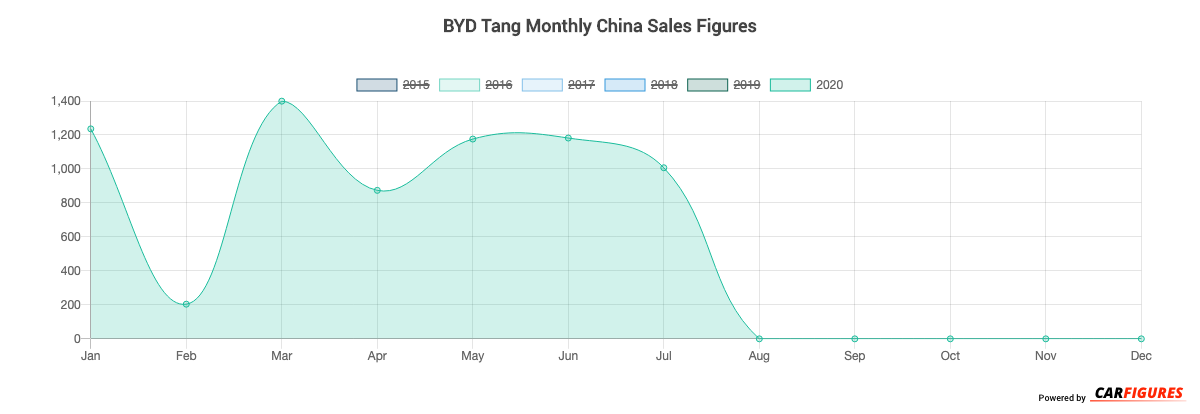
BYD sold 7,078 Tang in 2020. (From Jan - Dec 2020)
How many Tang did BYD sell in July 2020?
BYD sold 1,007 Tang in July 2020.
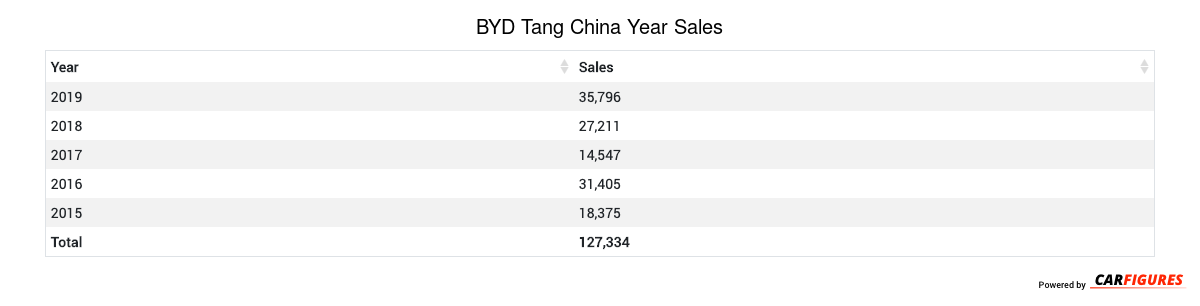
How many Tang did BYD sell in 2019?
BYD sold 35,796 Tang in 2019. In 2018, BYD sold 27,211 Tang. They sold 8,585 more units in 2019 compared to 2018 with a percent gain of 31.55% YoY.
Overview
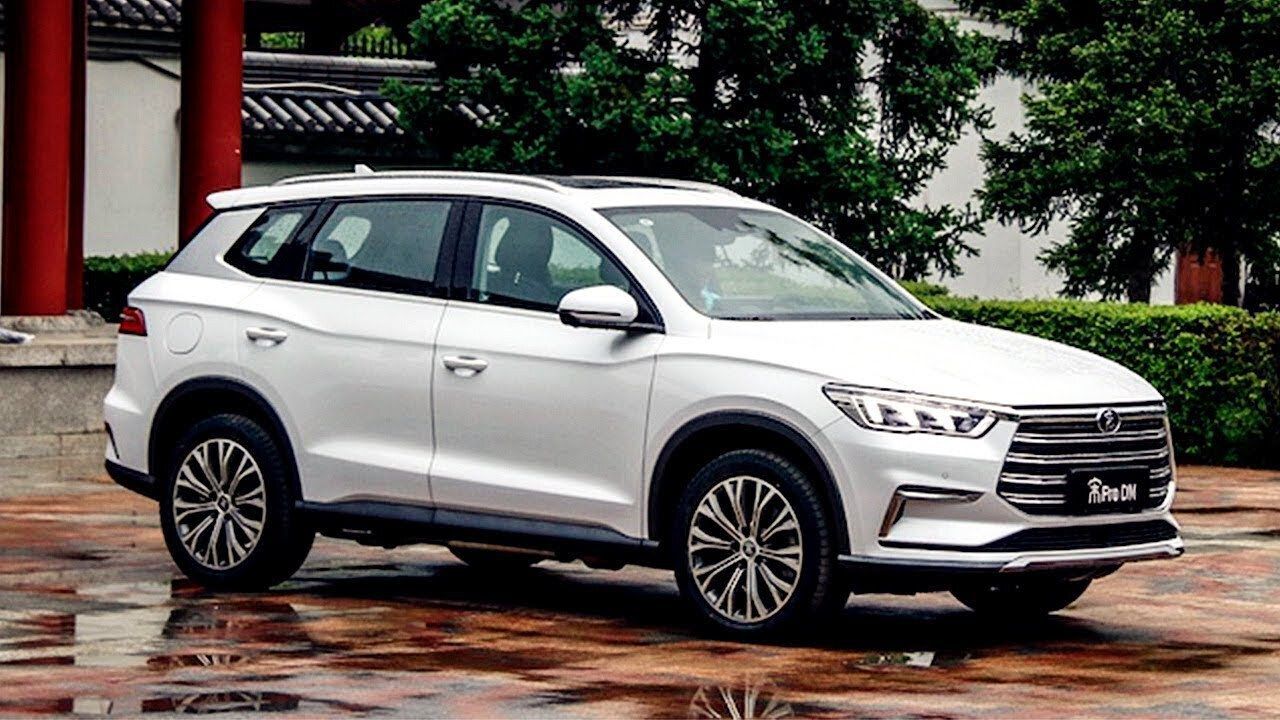
The Tang is a 5 doors 7 seats SUV with room for 7 people from automaker BYD.
How Much Does the BYD Tang Cost?
Pricing for the Tang starts at CN¥129,900 Yuan ($18,186 USD) MSRP and goes up to CN¥169,900 Yuan ($23,786 USD) fully equipped.
BYD Tang Engine and Performance
Tang is powered by a 2.0TL engine that makes 151 Kw (202.49 HP) - 151 Kw (202.49 HP) and 320 Nm (236.80 ft-lb) - 320 Nm (236.80 ft-lb) torque.
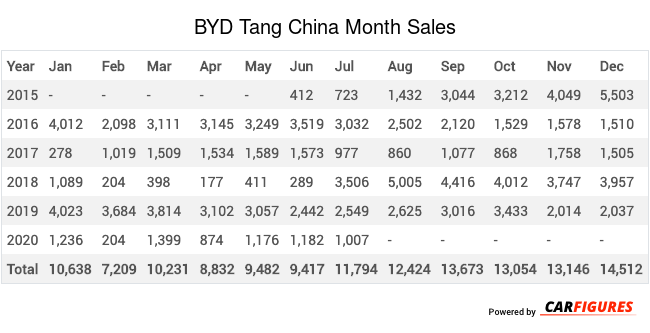
BYD Tang China Sale figures by year, quarter, and month are presented below. Including the most up to date sales data for the BYD Tang.
Year | Jan | Feb | Mar | Apr | May | Jun | Jul | Aug | Sep | Oct | Nov | Dec |
|---|---|---|---|---|---|---|---|---|---|---|---|---|
| 2015 | - | - | - | - | - | 412 | 723 | 1,432 | 3,044 | 3,212 | 4,049 | 5,503 |
| 2016 | 4,012 | 2,098 | 3,111 | 3,145 | 3,249 | 3,519 | 3,032 | 2,502 | 2,120 | 1,529 | 1,578 | 1,510 |
| 2017 | 278 | 1,019 | 1,509 | 1,534 | 1,589 | 1,573 | 977 | 860 | 1,077 | 868 | 1,758 | 1,505 |
| 2018 | 1,089 | 204 | 398 | 177 | 411 | 289 | 3,506 | 5,005 | 4,416 | 4,012 | 3,747 | 3,957 |
| 2019 | 4,023 | 3,684 | 3,814 | 3,102 | 3,057 | 2,442 | 2,549 | 2,625 | 3,016 | 3,433 | 2,014 | 2,037 |
| 2020 | 1,236 | 204 | 1,399 | 874 | 1,176 | 1,182 | 1,007 | - | - | - | - | - |
| Total | 10,638 | 7,209 | 10,231 | 8,832 | 9,482 | 9,417 | 11,794 | 12,424 | 13,673 | 13,054 | 13,146 | 14,512 |
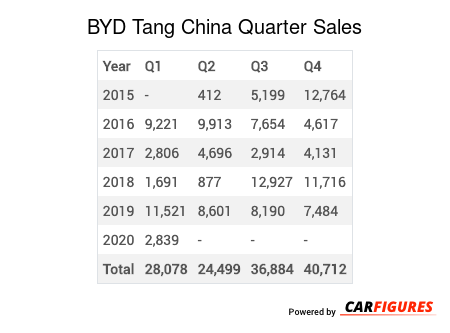
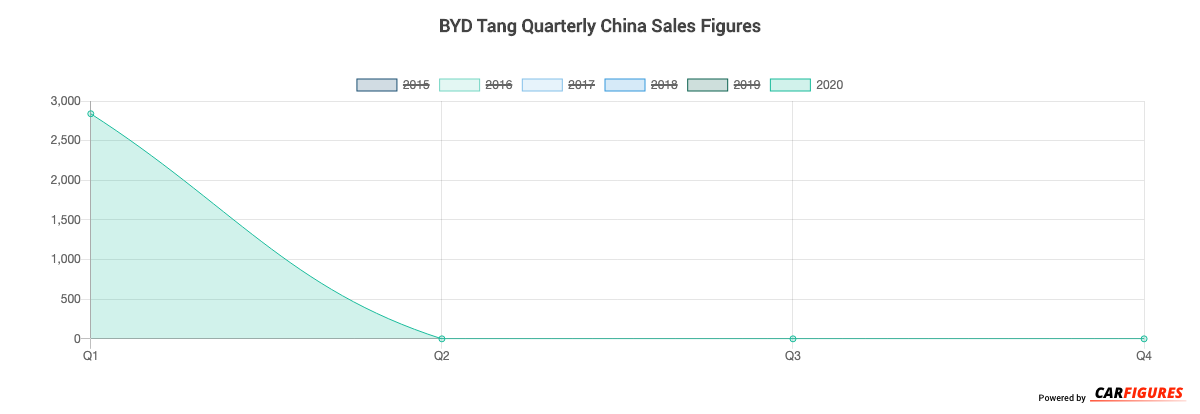
Year | Q1 | Q2 | Q3 | Q4 |
|---|---|---|---|---|
| 2015 | - | 412 | 5,199 | 12,764 |
| 2016 | 9,221 | 9,913 | 7,654 | 4,617 |
| 2017 | 2,806 | 4,696 | 2,914 | 4,131 |
| 2018 | 1,691 | 877 | 12,927 | 11,716 |
| 2019 | 11,521 | 8,601 | 8,190 | 7,484 |
| 2020 | 2,839 | - | - | - |
| Total | 28,078 | 24,499 | 36,884 | 40,712 |
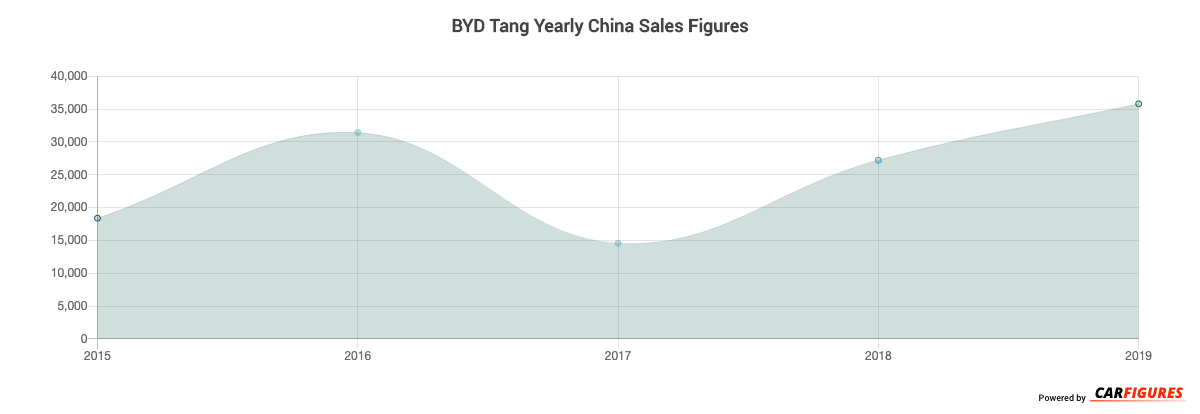
Year | Sales |
|---|---|
| 2020 | 2,839 |
| 2019 | 35,796 |
| 2018 | 27,211 |
| 2017 | 14,547 |
| 2016 | 31,405 |
| 2015 | 18,375 |
| Total | 130,173 |
Download Historic Sales Data
Embedded Code
See more widgetsSources: Manufacturers