Key Stats
How many 3 Series did BMW sell in 2020?
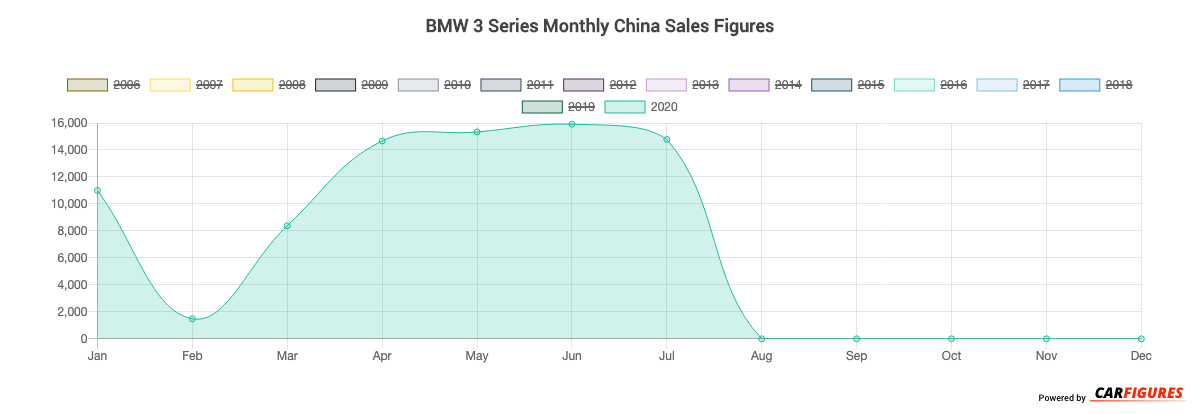
BMW sold 81,568 3 Series in 2020. (From Jan - Dec 2020)
How many 3 Series did BMW sell in July 2020?
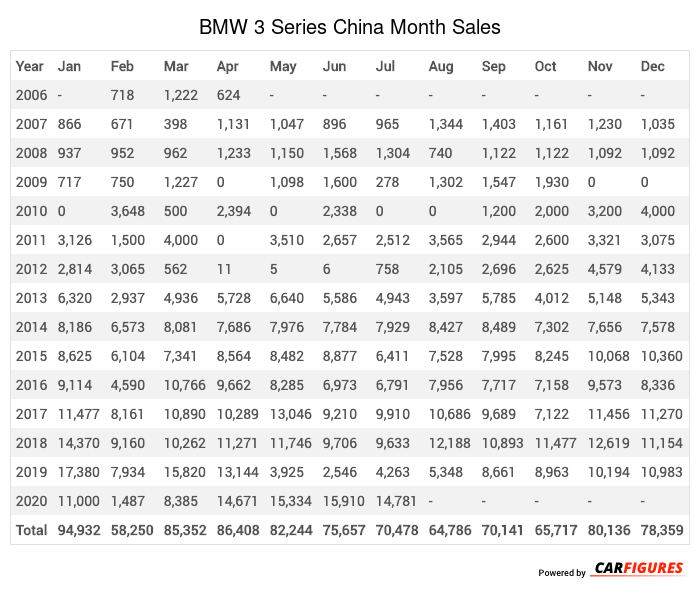
BMW sold 14,781 3 Series in July 2020.
How many 3 Series did BMW sell in 2019?
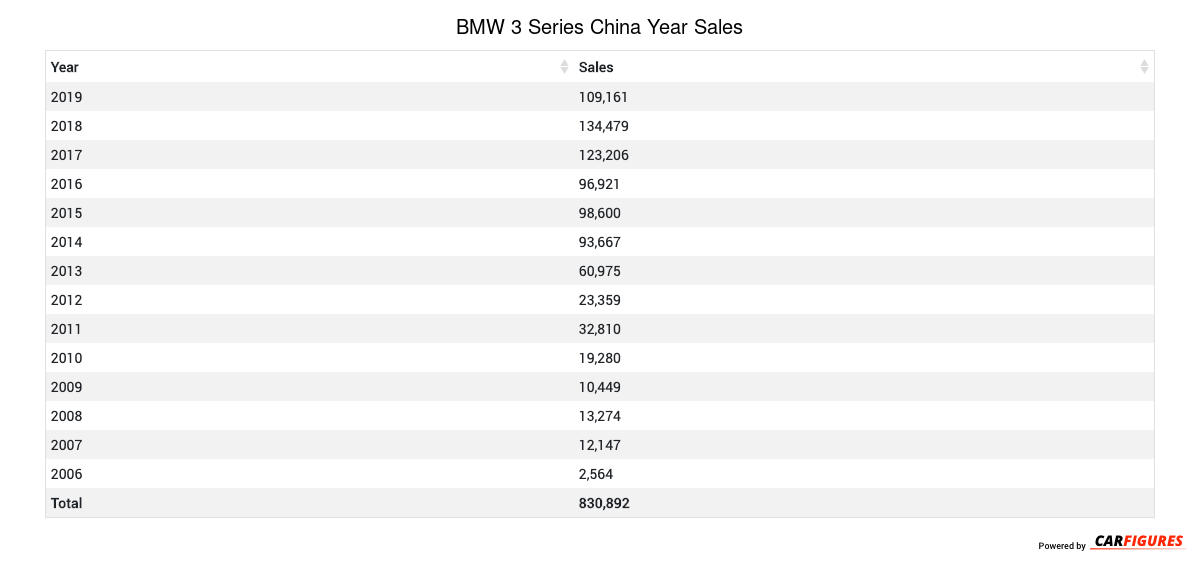
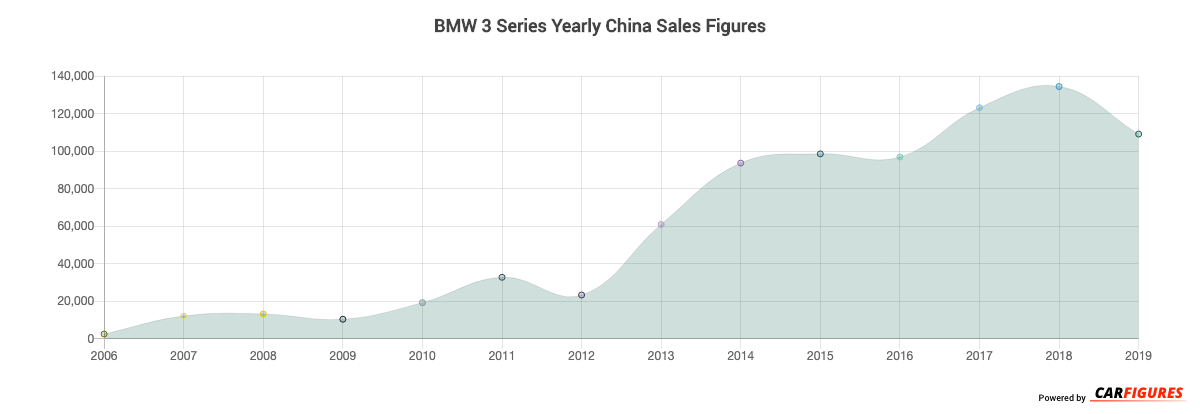
BMW sold 109,161 3 Series in 2019. In 2018, BMW sold 134,479 3 Series. They sold 25,318 more units in year 2018 compared to 2019 with a percent loss of 18.83% YoY.
Overview
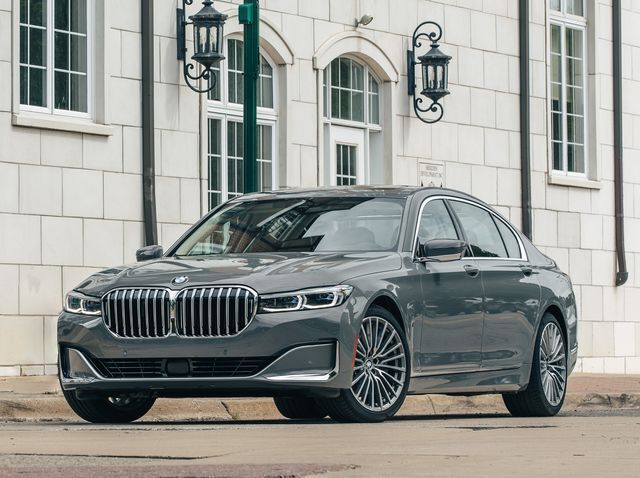
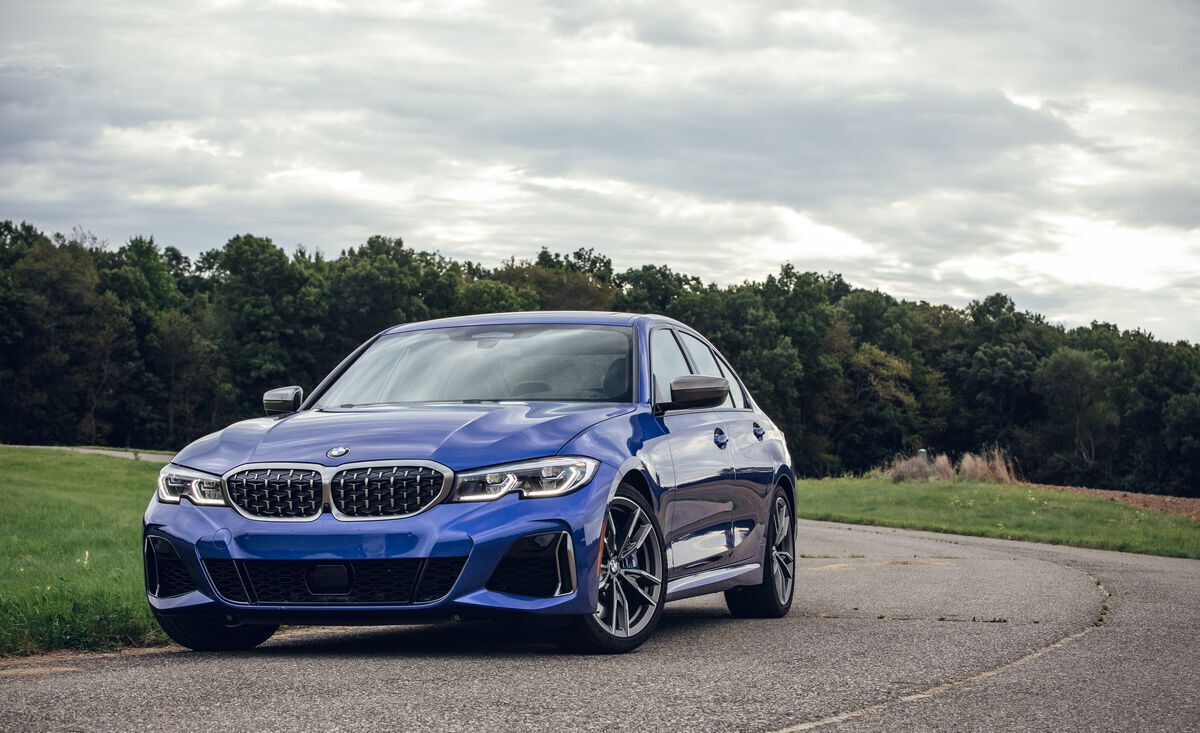
The 3 Series is a 4-door 5-seater sedan with room for 5 people from automaker BMW.
How Much Does the BMW 3 Series Cost?
Pricing for the 3 Series starts at CN¥313,900 Yuan ($43,946 USD) MSRP and goes up to CN¥363,900 Yuan ($50,946 USD) fully equipped.
BMW 3 Series Engine and Performance
3 Series includes a 2.0TL engine. This delivers 135 Kw (181.04 HP) - 135 Kw (181.04 HP) and 300 Nm (222.00 ft-lb) - 300 Nm (222.00 ft-lb) torque.
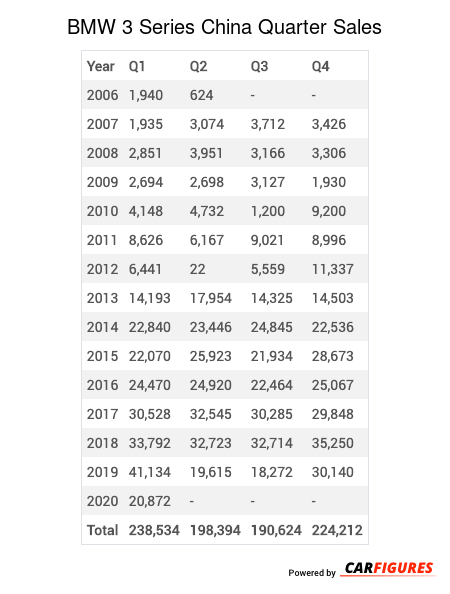
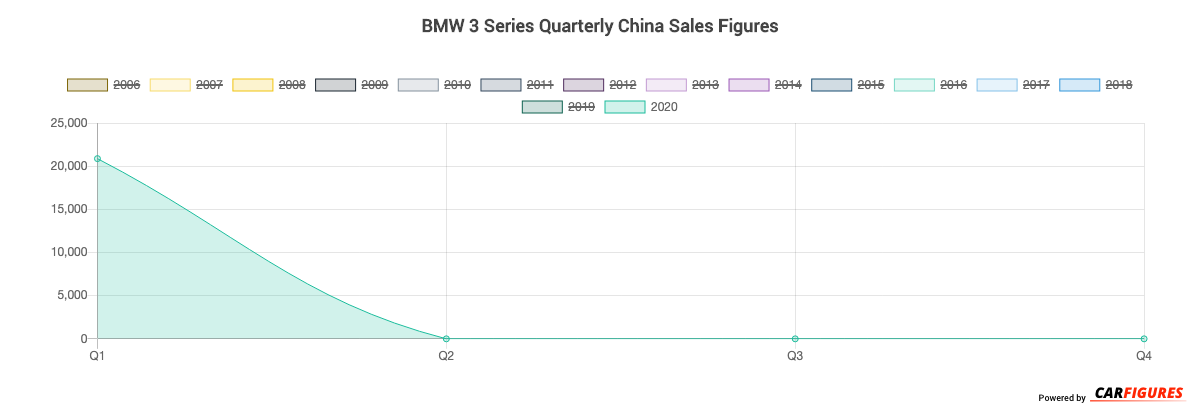
BMW 3 Series China Sale figures by year, quarter, and month are presented below. Including the most up to date sales data for the BMW 3 Series.
Year | Jan | Feb | Mar | Apr | May | Jun | Jul | Aug | Sep | Oct | Nov | Dec |
|---|---|---|---|---|---|---|---|---|---|---|---|---|
| 2006 | - | 718 | 1,222 | 624 | - | - | - | - | - | - | - | - |
| 2007 | 866 | 671 | 398 | 1,131 | 1,047 | 896 | 965 | 1,344 | 1,403 | 1,161 | 1,230 | 1,035 |
| 2008 | 937 | 952 | 962 | 1,233 | 1,150 | 1,568 | 1,304 | 740 | 1,122 | 1,122 | 1,092 | 1,092 |
| 2009 | 717 | 750 | 1,227 | 0 | 1,098 | 1,600 | 278 | 1,302 | 1,547 | 1,930 | 0 | 0 |
| 2010 | 0 | 3,648 | 500 | 2,394 | 0 | 2,338 | 0 | 0 | 1,200 | 2,000 | 3,200 | 4,000 |
| 2011 | 3,126 | 1,500 | 4,000 | 0 | 3,510 | 2,657 | 2,512 | 3,565 | 2,944 | 2,600 | 3,321 | 3,075 |
| 2012 | 2,814 | 3,065 | 562 | 11 | 5 | 6 | 758 | 2,105 | 2,696 | 2,625 | 4,579 | 4,133 |
| 2013 | 6,320 | 2,937 | 4,936 | 5,728 | 6,640 | 5,586 | 4,943 | 3,597 | 5,785 | 4,012 | 5,148 | 5,343 |
| 2014 | 8,186 | 6,573 | 8,081 | 7,686 | 7,976 | 7,784 | 7,929 | 8,427 | 8,489 | 7,302 | 7,656 | 7,578 |
| 2015 | 8,625 | 6,104 | 7,341 | 8,564 | 8,482 | 8,877 | 6,411 | 7,528 | 7,995 | 8,245 | 10,068 | 10,360 |
| 2016 | 9,114 | 4,590 | 10,766 | 9,662 | 8,285 | 6,973 | 6,791 | 7,956 | 7,717 | 7,158 | 9,573 | 8,336 |
| 2017 | 11,477 | 8,161 | 10,890 | 10,289 | 13,046 | 9,210 | 9,910 | 10,686 | 9,689 | 7,122 | 11,456 | 11,270 |
| 2018 | 14,370 | 9,160 | 10,262 | 11,271 | 11,746 | 9,706 | 9,633 | 12,188 | 10,893 | 11,477 | 12,619 | 11,154 |
| 2019 | 17,380 | 7,934 | 15,820 | 13,144 | 3,925 | 2,546 | 4,263 | 5,348 | 8,661 | 8,963 | 10,194 | 10,983 |
| 2020 | 11,000 | 1,487 | 8,385 | 14,671 | 15,334 | 15,910 | 14,781 | - | - | - | - | - |
| Total | 94,932 | 58,250 | 85,352 | 86,408 | 82,244 | 75,657 | 70,478 | 64,786 | 70,141 | 65,717 | 80,136 | 78,359 |
Year | Q1 | Q2 | Q3 | Q4 |
|---|---|---|---|---|
| 2006 | 1,940 | 624 | - | - |
| 2007 | 1,935 | 3,074 | 3,712 | 3,426 |
| 2008 | 2,851 | 3,951 | 3,166 | 3,306 |
| 2009 | 2,694 | 2,698 | 3,127 | 1,930 |
| 2010 | 4,148 | 4,732 | 1,200 | 9,200 |
| 2011 | 8,626 | 6,167 | 9,021 | 8,996 |
| 2012 | 6,441 | 22 | 5,559 | 11,337 |
| 2013 | 14,193 | 17,954 | 14,325 | 14,503 |
| 2014 | 22,840 | 23,446 | 24,845 | 22,536 |
| 2015 | 22,070 | 25,923 | 21,934 | 28,673 |
| 2016 | 24,470 | 24,920 | 22,464 | 25,067 |
| 2017 | 30,528 | 32,545 | 30,285 | 29,848 |
| 2018 | 33,792 | 32,723 | 32,714 | 35,250 |
| 2019 | 41,134 | 19,615 | 18,272 | 30,140 |
| 2020 | 20,872 | - | - | - |
| Total | 238,534 | 198,394 | 190,624 | 224,212 |
Year | Sales |
|---|---|
| 2020 | 20,872 |
| 2019 | 109,161 |
| 2018 | 134,479 |
| 2017 | 123,206 |
| 2016 | 96,921 |
| 2015 | 98,600 |
| 2014 | 93,667 |
| 2013 | 60,975 |
| 2012 | 23,359 |
| 2011 | 32,810 |
| 2010 | 19,280 |
| 2009 | 10,449 |
| 2008 | 13,274 |
| 2007 | 12,147 |
| 2006 | 2,564 |
| Total | 851,764 |
Download Historic Sales Data
Looking for more data/visualizations? Send us an email at contact@carfigures.com for customized data aggregates and visualizations.Embedded Code
See more widgetsSources: Manufacturers

