Key Stats
How many B50 did Bestune sell in December 2019?
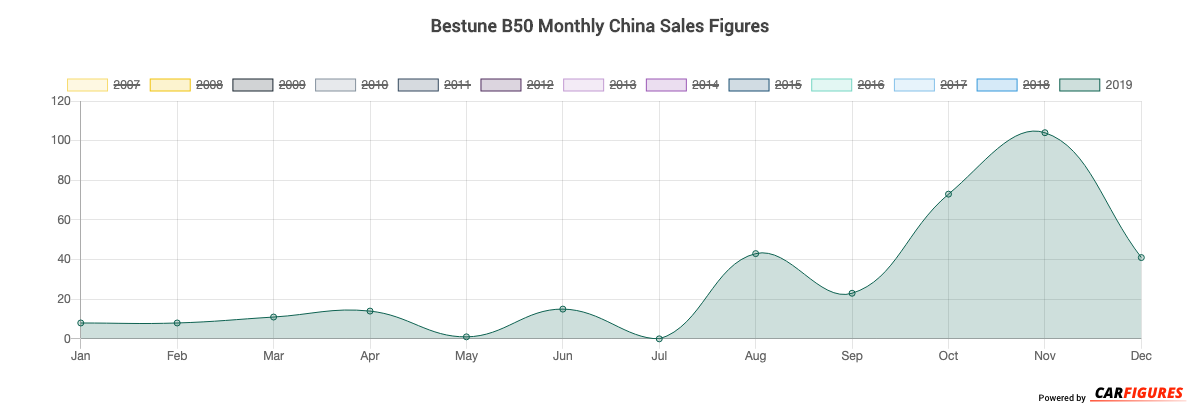
Bestune sold 41 B50 in December 2019.
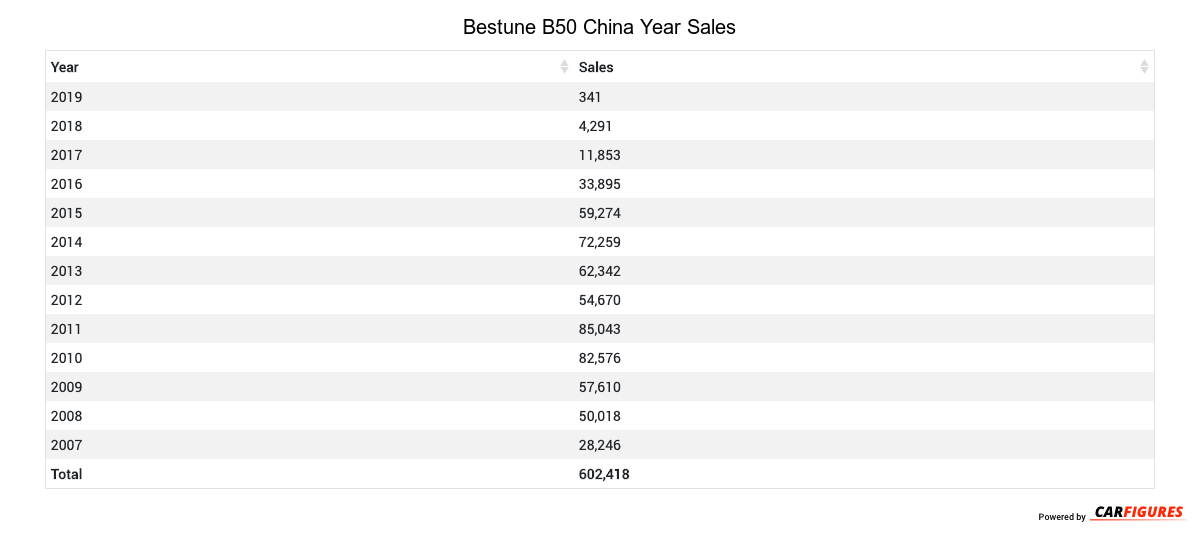
How many B50 did Bestune sell in 2019?
Bestune sold 341 B50 in 2019. In 2018, Bestune sold 4,291 B50. They sold 3,950 more units in year 2018 compared to 2019 with a percent loss of 92.05% YoY.
Overview
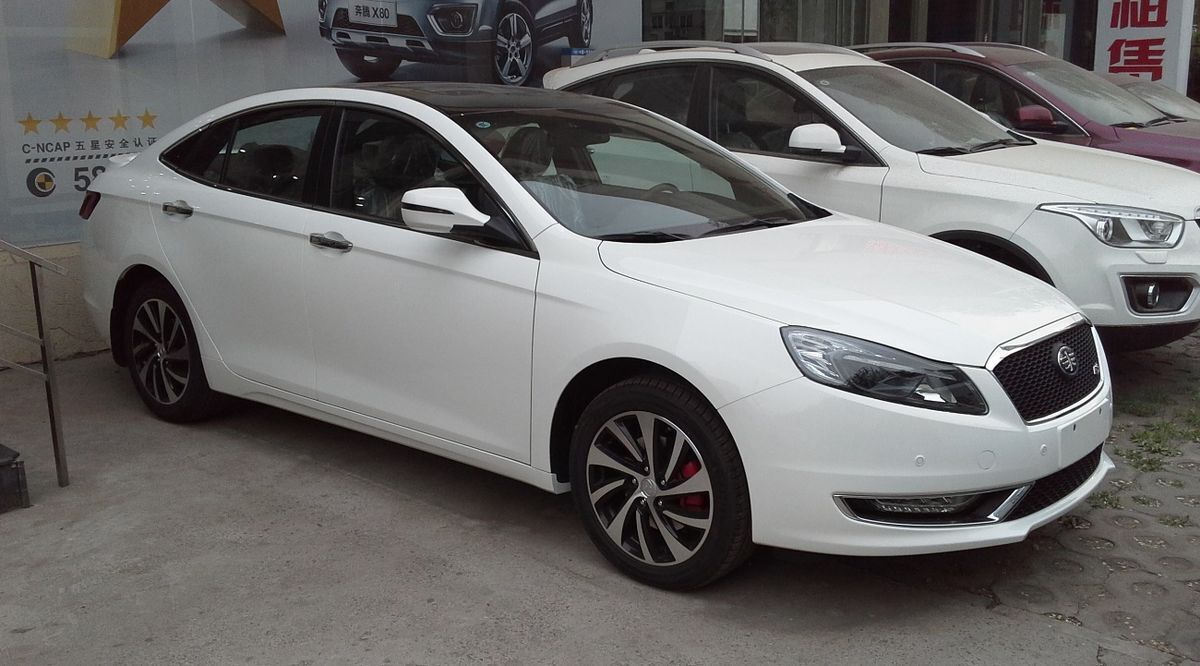
The B50 is a 4-door 5-seater sedan with room for 5 people from automaker Bestune.
How Much Does the Bestune B50 Cost?
Pricing for the B50 starts at CN¥85,900 Yuan ($12,026 USD) MSRP and goes up to CN¥104,900 Yuan ($14,686 USD) fully equipped.
Bestune B50 Engine and Performance
B50 includes a 1.6LL engine. This delivers 80 Kw (107.28 HP) - 100 Kw (134.10 HP) and 155 Nm (114.70 ft-lb) - 220 Nm (162.80 ft-lb) torque.
Bestune B50 Specifications
The B50 has a curb weight of 1,400 kg (3,000 lbs) - 1,400 kg (3,200 lbs).
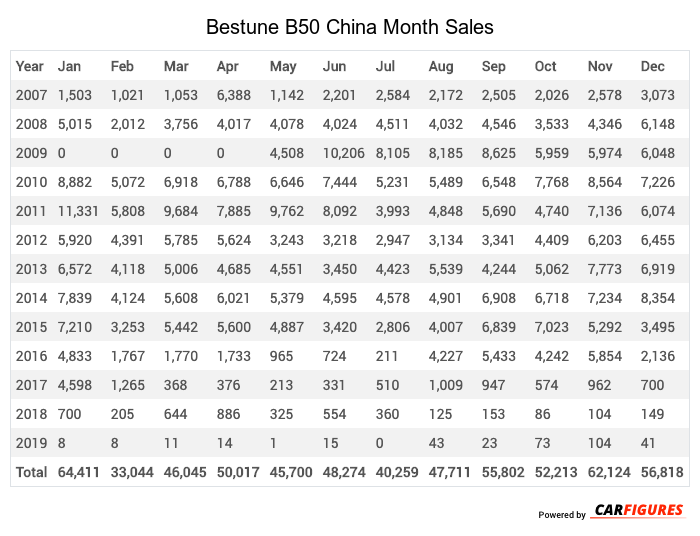
Bestune B50 China Sale figures by year, quarter, and month are presented below. Including the most up to date sales data for the Bestune B50.
Year | Jan | Feb | Mar | Apr | May | Jun | Jul | Aug | Sep | Oct | Nov | Dec |
|---|---|---|---|---|---|---|---|---|---|---|---|---|
| 2007 | 1,503 | 1,021 | 1,053 | 6,388 | 1,142 | 2,201 | 2,584 | 2,172 | 2,505 | 2,026 | 2,578 | 3,073 |
| 2008 | 5,015 | 2,012 | 3,756 | 4,017 | 4,078 | 4,024 | 4,511 | 4,032 | 4,546 | 3,533 | 4,346 | 6,148 |
| 2009 | 0 | 0 | 0 | 0 | 4,508 | 10,206 | 8,105 | 8,185 | 8,625 | 5,959 | 5,974 | 6,048 |
| 2010 | 8,882 | 5,072 | 6,918 | 6,788 | 6,646 | 7,444 | 5,231 | 5,489 | 6,548 | 7,768 | 8,564 | 7,226 |
| 2011 | 11,331 | 5,808 | 9,684 | 7,885 | 9,762 | 8,092 | 3,993 | 4,848 | 5,690 | 4,740 | 7,136 | 6,074 |
| 2012 | 5,920 | 4,391 | 5,785 | 5,624 | 3,243 | 3,218 | 2,947 | 3,134 | 3,341 | 4,409 | 6,203 | 6,455 |
| 2013 | 6,572 | 4,118 | 5,006 | 4,685 | 4,551 | 3,450 | 4,423 | 5,539 | 4,244 | 5,062 | 7,773 | 6,919 |
| 2014 | 7,839 | 4,124 | 5,608 | 6,021 | 5,379 | 4,595 | 4,578 | 4,901 | 6,908 | 6,718 | 7,234 | 8,354 |
| 2015 | 7,210 | 3,253 | 5,442 | 5,600 | 4,887 | 3,420 | 2,806 | 4,007 | 6,839 | 7,023 | 5,292 | 3,495 |
| 2016 | 4,833 | 1,767 | 1,770 | 1,733 | 965 | 724 | 211 | 4,227 | 5,433 | 4,242 | 5,854 | 2,136 |
| 2017 | 4,598 | 1,265 | 368 | 376 | 213 | 331 | 510 | 1,009 | 947 | 574 | 962 | 700 |
| 2018 | 700 | 205 | 644 | 886 | 325 | 554 | 360 | 125 | 153 | 86 | 104 | 149 |
| 2019 | 8 | 8 | 11 | 14 | 1 | 15 | 0 | 43 | 23 | 73 | 104 | 41 |
| Total | 64,411 | 33,044 | 46,045 | 50,017 | 45,700 | 48,274 | 40,259 | 47,711 | 55,802 | 52,213 | 62,124 | 56,818 |
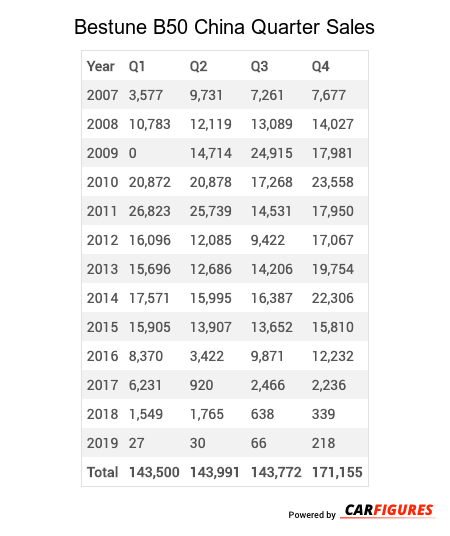
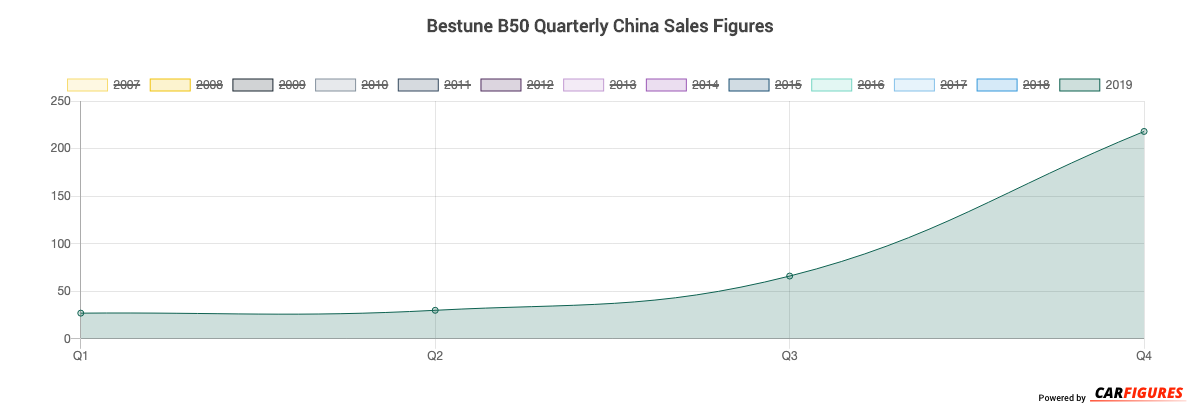
Year | Q1 | Q2 | Q3 | Q4 |
|---|---|---|---|---|
| 2007 | 3,577 | 9,731 | 7,261 | 7,677 |
| 2008 | 10,783 | 12,119 | 13,089 | 14,027 |
| 2009 | 0 | 14,714 | 24,915 | 17,981 |
| 2010 | 20,872 | 20,878 | 17,268 | 23,558 |
| 2011 | 26,823 | 25,739 | 14,531 | 17,950 |
| 2012 | 16,096 | 12,085 | 9,422 | 17,067 |
| 2013 | 15,696 | 12,686 | 14,206 | 19,754 |
| 2014 | 17,571 | 15,995 | 16,387 | 22,306 |
| 2015 | 15,905 | 13,907 | 13,652 | 15,810 |
| 2016 | 8,370 | 3,422 | 9,871 | 12,232 |
| 2017 | 6,231 | 920 | 2,466 | 2,236 |
| 2018 | 1,549 | 1,765 | 638 | 339 |
| 2019 | 27 | 30 | 66 | 218 |
| Total | 143,500 | 143,991 | 143,772 | 171,155 |
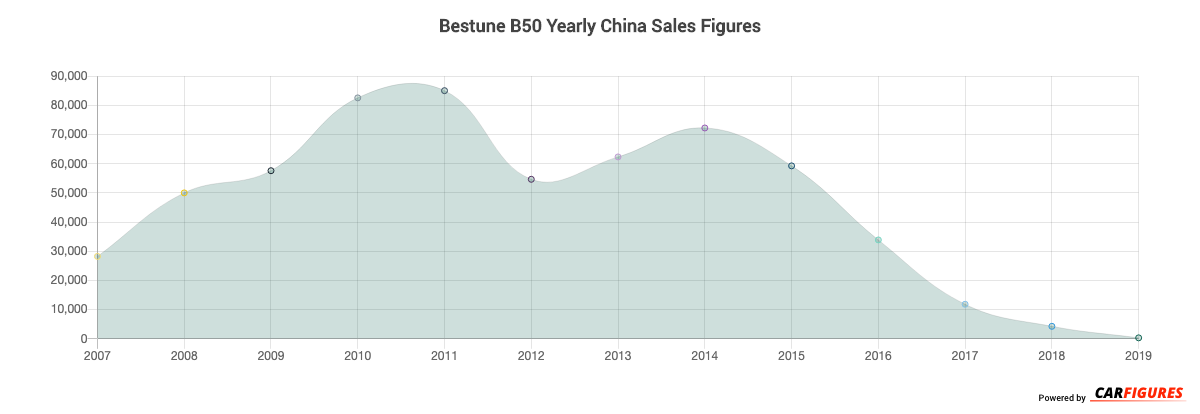
Year | Sales |
|---|---|
| 2019 | 341 |
| 2018 | 4,291 |
| 2017 | 11,853 |
| 2016 | 33,895 |
| 2015 | 59,274 |
| 2014 | 72,259 |
| 2013 | 62,342 |
| 2012 | 54,670 |
| 2011 | 85,043 |
| 2010 | 82,576 |
| 2009 | 57,610 |
| 2008 | 50,018 |
| 2007 | 28,246 |
| Total | 602,418 |
Download Historic Sales Data
Embedded Code
See more widgetsSources: Manufacturers