Key Stats
How many X80 did Bestune sell in 2020?
Bestune sold 246 X80 in 2020. (From Jan - Dec 2020)
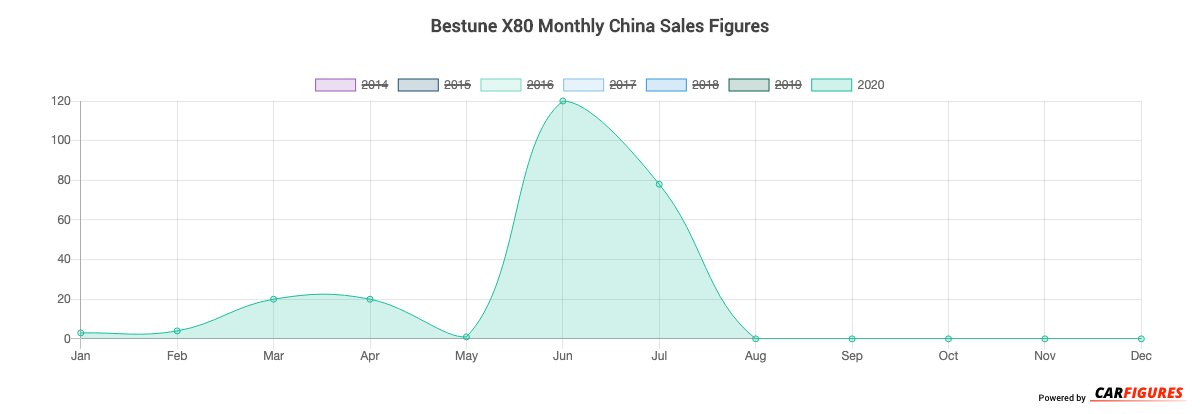
How many X80 did Bestune sell in July 2020?
Bestune sold 78 X80 in July 2020.
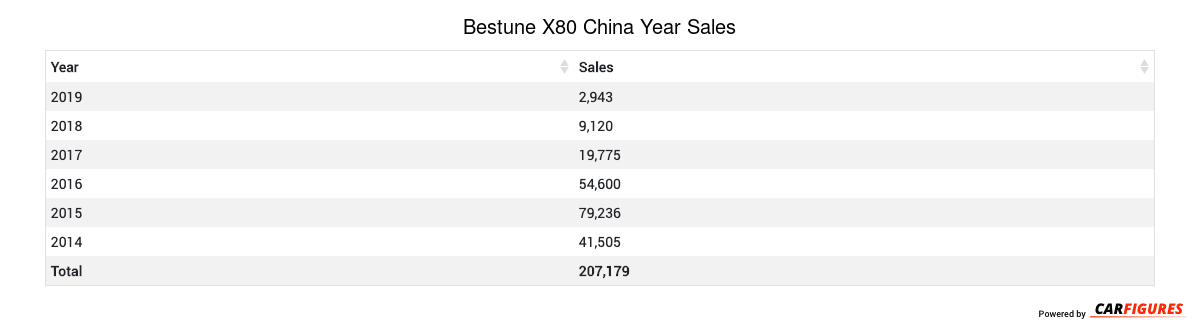
How many X80 did Bestune sell in 2019?
Bestune sold 2,943 X80 in 2019. In 2018, Bestune sold 9,120 X80. They sold 6,177 more units in year 2018 compared to 2019 with a percent loss of 67.73% YoY.
Overview
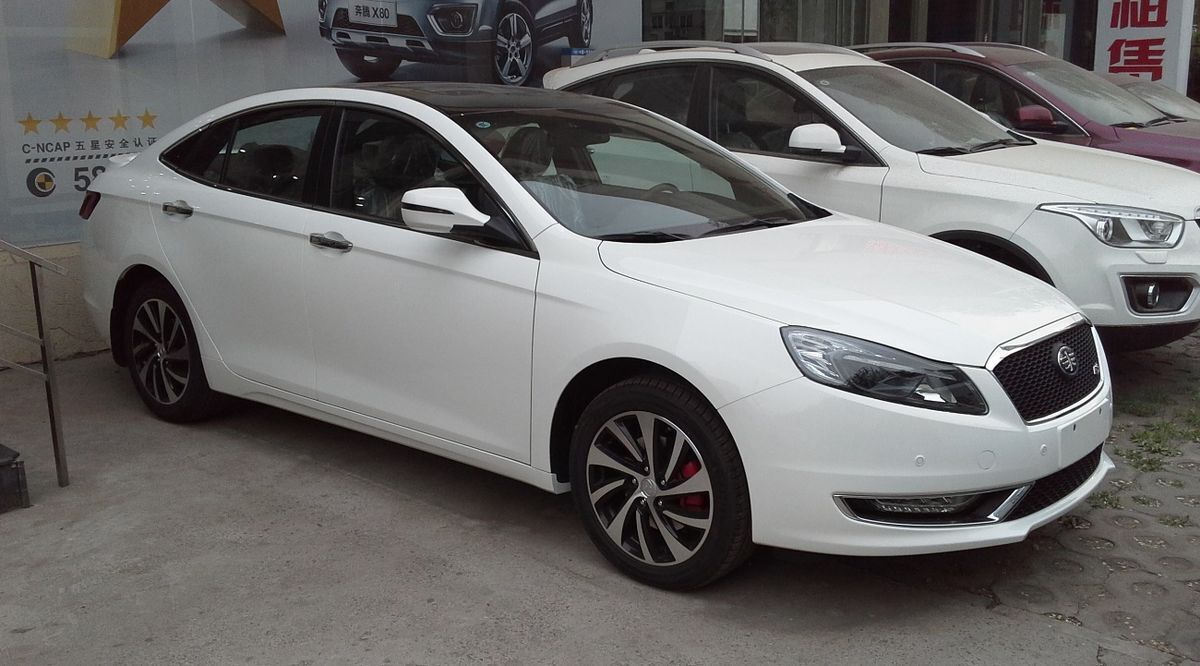
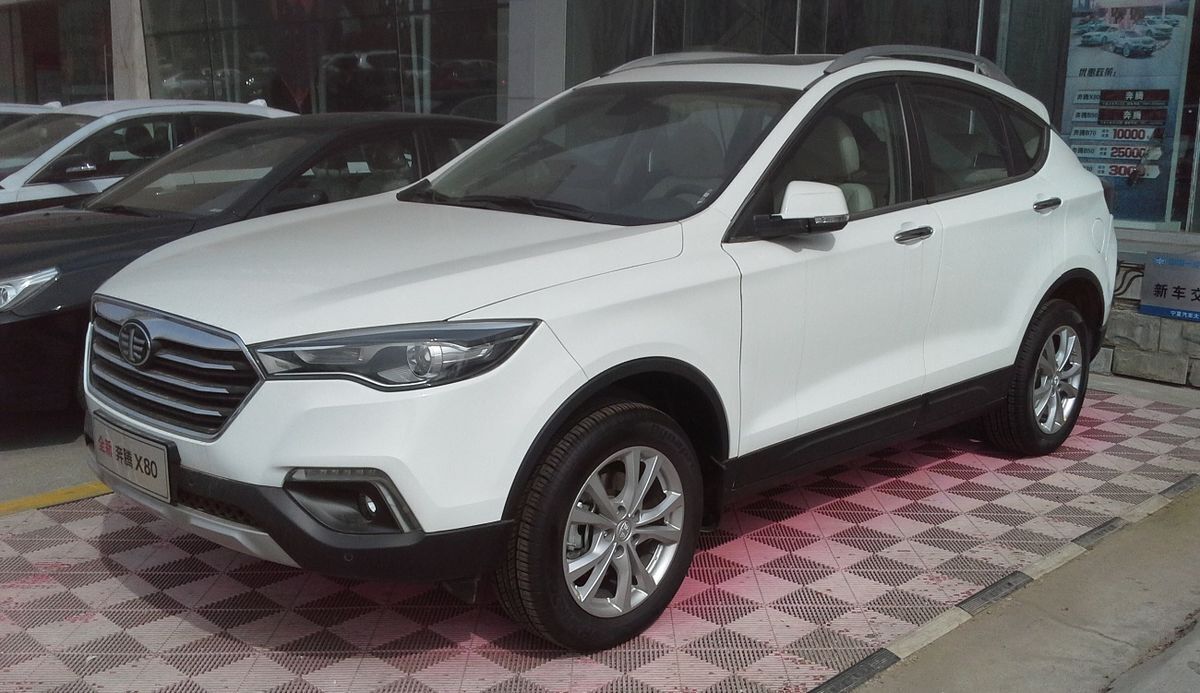
The X80 is a 5 doors 5 seats SUV with room for 5 people from automaker Bestune.
How Much Does the Bestune X80 Cost?
Pricing for the X80 starts at CN¥99,800 Yuan ($13,972 USD) MSRP and goes up to CN¥147,800 Yuan ($20,692 USD) fully equipped.
Bestune X80 Engine and Performance
X80 is powered by a 2.0LL engine that makes 108 Kw (144.83 HP) - 137 Kw (183.72 HP) and 184 Nm (136.16 ft-lb) - 235 Nm (173.90 ft-lb) torque.
Bestune X80 Specifications
The X80 has a curb weight of 1,500 kg (3,300 lbs) - 1,600 kg (3,500 lbs).
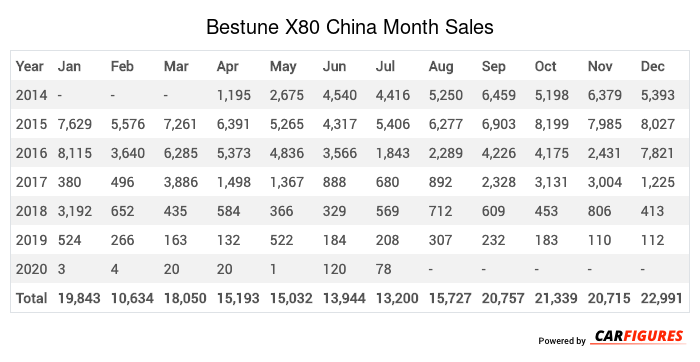
Bestune X80 China Sale figures by year, quarter, and month are presented below. Including the most up to date sales data for the Bestune X80.
Year | Jan | Feb | Mar | Apr | May | Jun | Jul | Aug | Sep | Oct | Nov | Dec |
|---|---|---|---|---|---|---|---|---|---|---|---|---|
| 2014 | - | - | - | 1,195 | 2,675 | 4,540 | 4,416 | 5,250 | 6,459 | 5,198 | 6,379 | 5,393 |
| 2015 | 7,629 | 5,576 | 7,261 | 6,391 | 5,265 | 4,317 | 5,406 | 6,277 | 6,903 | 8,199 | 7,985 | 8,027 |
| 2016 | 8,115 | 3,640 | 6,285 | 5,373 | 4,836 | 3,566 | 1,843 | 2,289 | 4,226 | 4,175 | 2,431 | 7,821 |
| 2017 | 380 | 496 | 3,886 | 1,498 | 1,367 | 888 | 680 | 892 | 2,328 | 3,131 | 3,004 | 1,225 |
| 2018 | 3,192 | 652 | 435 | 584 | 366 | 329 | 569 | 712 | 609 | 453 | 806 | 413 |
| 2019 | 524 | 266 | 163 | 132 | 522 | 184 | 208 | 307 | 232 | 183 | 110 | 112 |
| 2020 | 3 | 4 | 20 | 20 | 1 | 120 | 78 | - | - | - | - | - |
| Total | 19,843 | 10,634 | 18,050 | 15,193 | 15,032 | 13,944 | 13,200 | 15,727 | 20,757 | 21,339 | 20,715 | 22,991 |
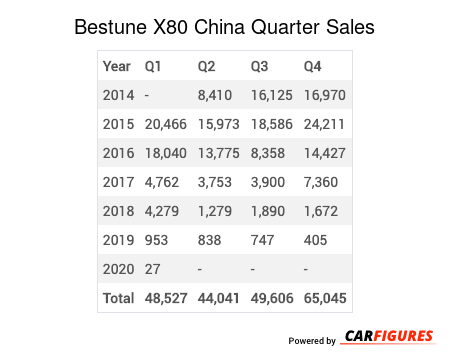
Year | Q1 | Q2 | Q3 | Q4 |
|---|---|---|---|---|
| 2014 | - | 8,410 | 16,125 | 16,970 |
| 2015 | 20,466 | 15,973 | 18,586 | 24,211 |
| 2016 | 18,040 | 13,775 | 8,358 | 14,427 |
| 2017 | 4,762 | 3,753 | 3,900 | 7,360 |
| 2018 | 4,279 | 1,279 | 1,890 | 1,672 |
| 2019 | 953 | 838 | 747 | 405 |
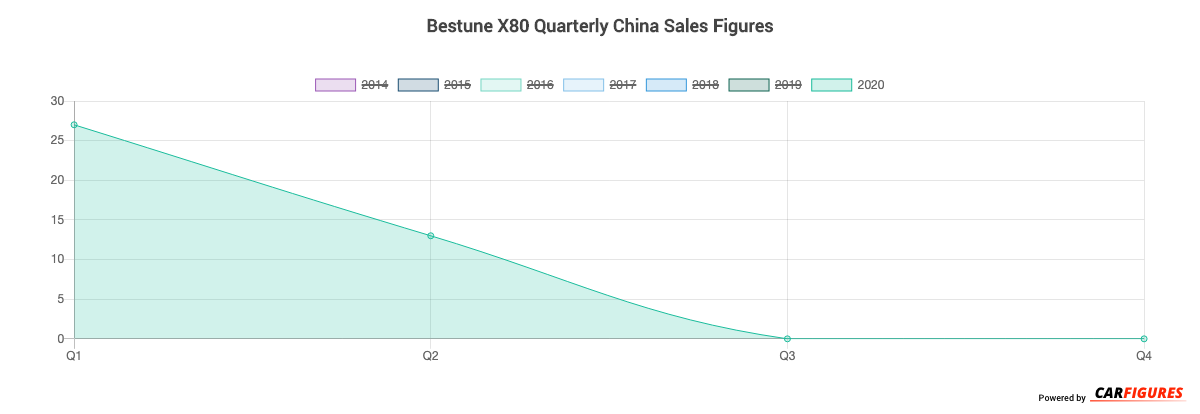
| 2020 | 27 | 13 | - | - |
| Total | 48,527 | 44,041 | 49,606 | 65,045 |
Year | Sales |
|---|---|
| 2020 | 40 |
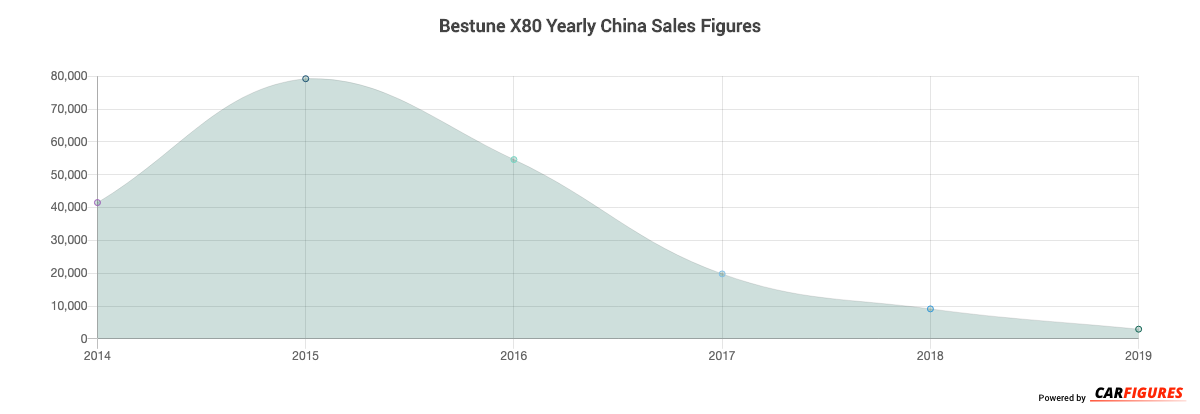
| 2019 | 2,943 |
| 2018 | 9,120 |
| 2017 | 19,775 |
| 2016 | 54,600 |
| 2015 | 79,236 |
| 2014 | 41,505 |
| Total | 207,219 |
Download Historic Sales Data
Embedded Code
See more widgetsSources: Manufacturers