Key Stats
How many Mazda5 did Mazda sell in October 2018?
Mazda sold 1 Mazda5 in October 2018.
Overview
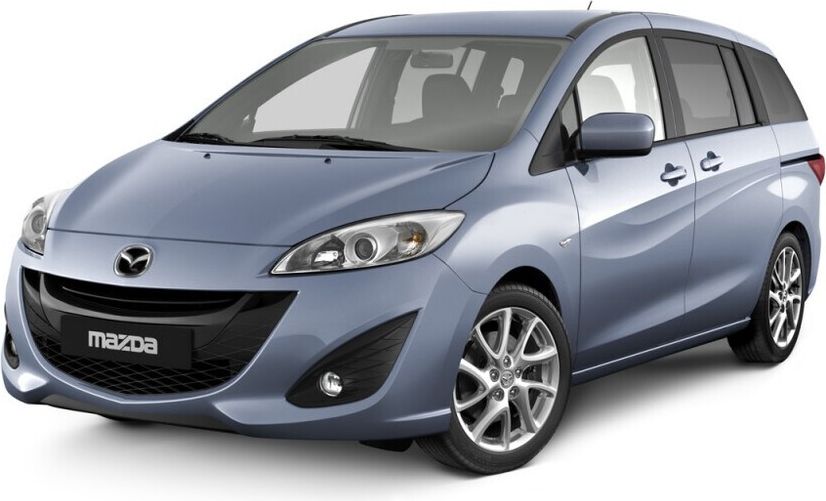
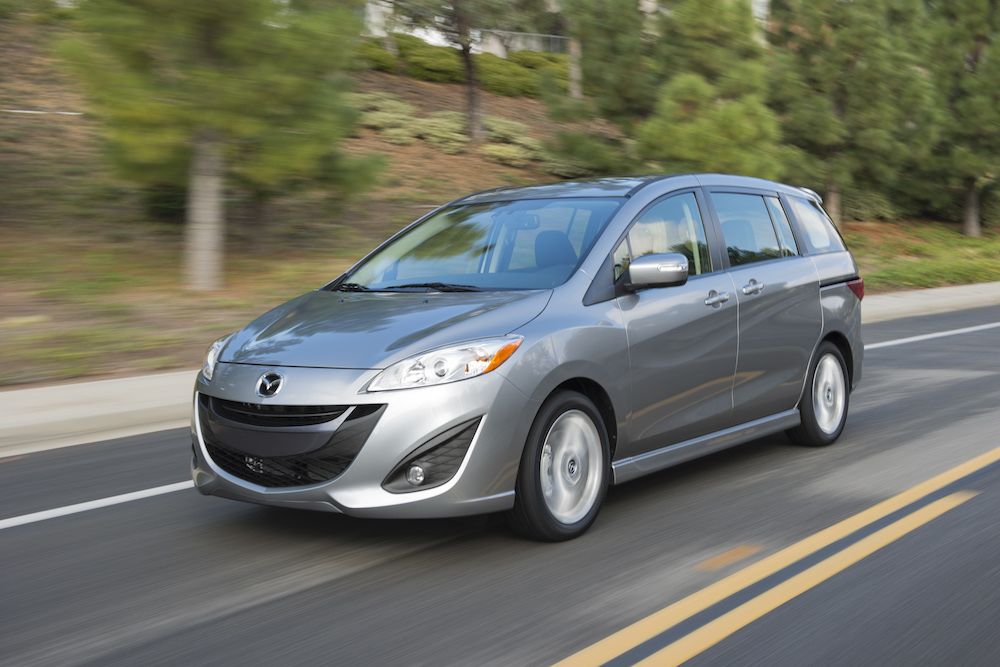
The 2017 Mazda Mazda5 seats up to 6 people and has a starting weight of 1560 kg.
How Much Does the 2017 Mazda Mazda5 Cost?
Pricing for the 2017 Mazda Mazda5 starts at $21,995 MSRP and goes up to $27,995 fully loaded.
Mazda Mazda5 Engine, Transmission, and Performance Numbers
Mazda Mazda5 is powered by a front-wheel-drive powertrain that makes 157 horsepower and 163 ft-lb torque.
2017 Mazda Mazda5 Fuel Economy
The 2017 Mazda Mazda5 is expected to get 8 L/100 km in the city, 8 L/100 km on the highway. The 2017 Mazda Mazda5 can hold 60 liters of fuel for a maximum range of kilometers.
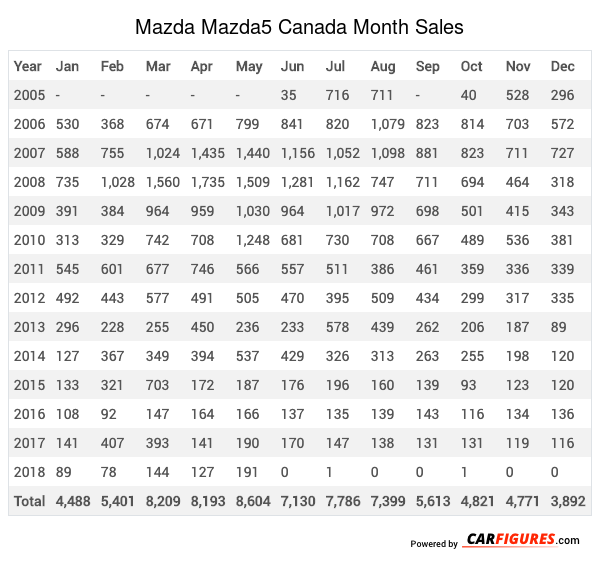
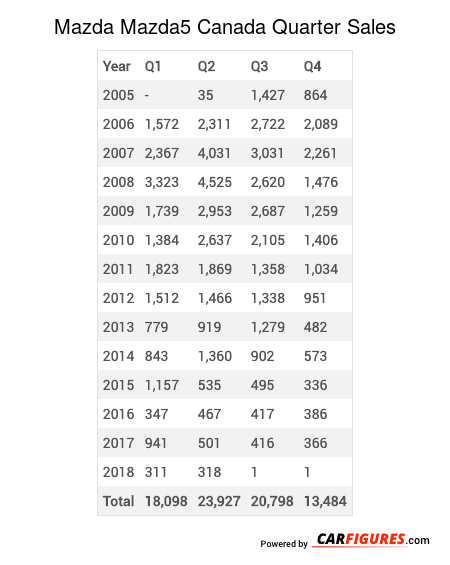
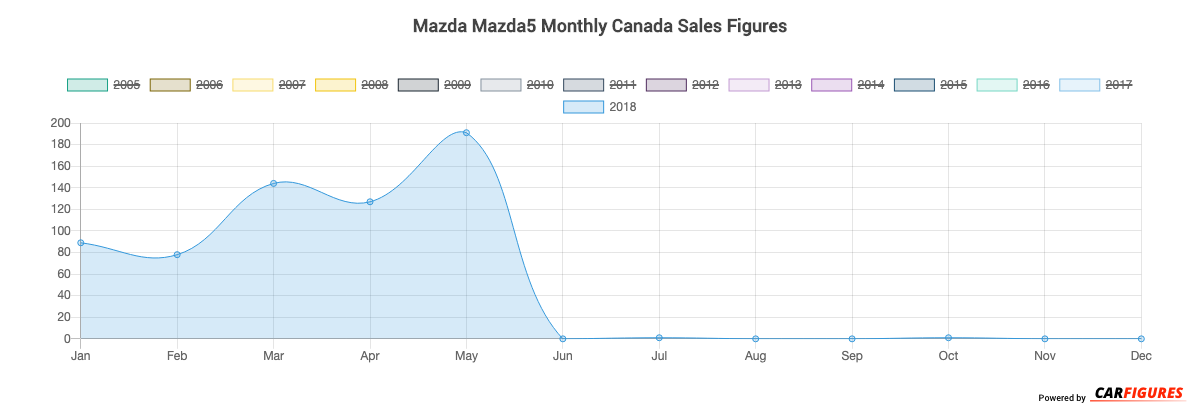
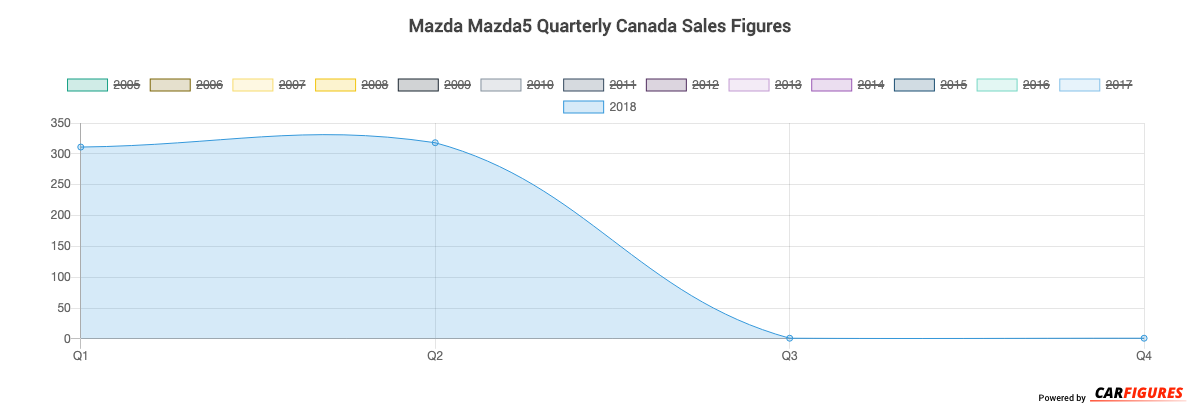
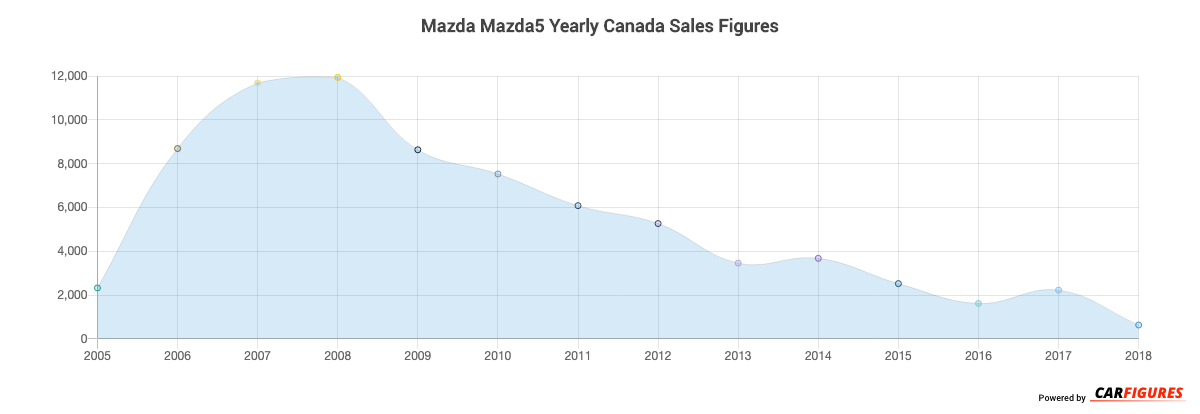
Mazda Mazda5 Canadian Sale figures by year, quarter, and month are presented below. Including the most up to date sales data for the Mazda Mazda5.
Loading, please wait
Year | Jan | Feb | Mar | Apr | May | Jun | Jul | Aug | Sep | Oct | Nov | Dec |
|---|---|---|---|---|---|---|---|---|---|---|---|---|
| 2005 | - | - | - | - | - | 35 | 716 | 711 | - | 40 | 528 | 296 |
| 2006 | 530 | 368 | 674 | 671 | 799 | 841 | 820 | 1,079 | 823 | 814 | 703 | 572 |
| 2007 | 588 | 755 | 1,024 | 1,435 | 1,440 | 1,156 | 1,052 | 1,098 | 881 | 823 | 711 | 727 |
| 2008 | 735 | 1,028 | 1,560 | 1,735 | 1,509 | 1,281 | 1,162 | 747 | 711 | 694 | 464 | 318 |
| 2009 | 391 | 384 | 964 | 959 | 1,030 | 964 | 1,017 | 972 | 698 | 501 | 415 | 343 |
| 2010 | 313 | 329 | 742 | 708 | 1,248 | 681 | 730 | 708 | 667 | 489 | 536 | 381 |
| 2011 | 545 | 601 | 677 | 746 | 566 | 557 | 511 | 386 | 461 | 359 | 336 | 339 |
| 2012 | 492 | 443 | 577 | 491 | 505 | 470 | 395 | 509 | 434 | 299 | 317 | 335 |
| 2013 | 296 | 228 | 255 | 450 | 236 | 233 | 578 | 439 | 262 | 206 | 187 | 89 |
| 2014 | 127 | 367 | 349 | 394 | 537 | 429 | 326 | 313 | 263 | 255 | 198 | 120 |
| 2015 | 133 | 321 | 703 | 172 | 187 | 176 | 196 | 160 | 139 | 93 | 123 | 120 |
| 2016 | 108 | 92 | 147 | 164 | 166 | 137 | 135 | 139 | 143 | 116 | 134 | 136 |
| 2017 | 141 | 407 | 393 | 141 | 190 | 170 | 147 | 138 | 131 | 131 | 119 | 116 |
| 2018 | 89 | 78 | 144 | 127 | 191 | 0 | 1 | 0 | 0 | 1 | 0 | 0 |
| Total | 4,488 | 5,401 | 8,209 | 8,193 | 8,604 | 7,130 | 7,786 | 7,399 | 5,613 | 4,821 | 4,771 | 3,892 |
Loading, please wait
Year | Q1 | Q2 | Q3 | Q4 |
|---|---|---|---|---|
| 2005 | - | 35 | 1,427 | 864 |
| 2006 | 1,572 | 2,311 | 2,722 | 2,089 |
| 2007 | 2,367 | 4,031 | 3,031 | 2,261 |
| 2008 | 3,323 | 4,525 | 2,620 | 1,476 |
| 2009 | 1,739 | 2,953 | 2,687 | 1,259 |
| 2010 | 1,384 | 2,637 | 2,105 | 1,406 |
| 2011 | 1,823 | 1,869 | 1,358 | 1,034 |
| 2012 | 1,512 | 1,466 | 1,338 | 951 |
| 2013 | 779 | 919 | 1,279 | 482 |
| 2014 | 843 | 1,360 | 902 | 573 |
| 2015 | 1,157 | 535 | 495 | 336 |
| 2016 | 347 | 467 | 417 | 386 |
| 2017 | 941 | 501 | 416 | 366 |
| 2018 | 311 | 318 | 1 | 1 |
| Total | 18,098 | 23,927 | 20,798 | 13,484 |
Loading, please wait
Year | Sales |
|---|---|
| 2018 | 631 |
| 2017 | 2,224 |
| 2016 | 1,617 |
| 2015 | 2,523 |
| 2014 | 3,678 |
| 2013 | 3,459 |
| 2012 | 5,267 |
| 2011 | 6,084 |
| 2010 | 7,532 |
| 2009 | 8,638 |
| 2008 | 11,944 |
| 2007 | 11,690 |
| 2006 | 8,694 |
| 2005 | 2,326 |
| Total | 76,307 |
Download Historic Sales Data

Embedded Code
See more widgetsSources: Manufacturers