Key Stats
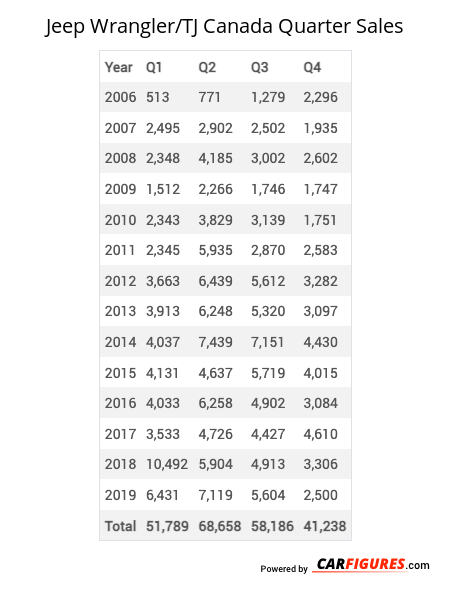
How many Wrangler/TJ did Jeep sell in Q4 2019?
Jeep sold 2,500 Wrangler/TJ in Q4 2019.
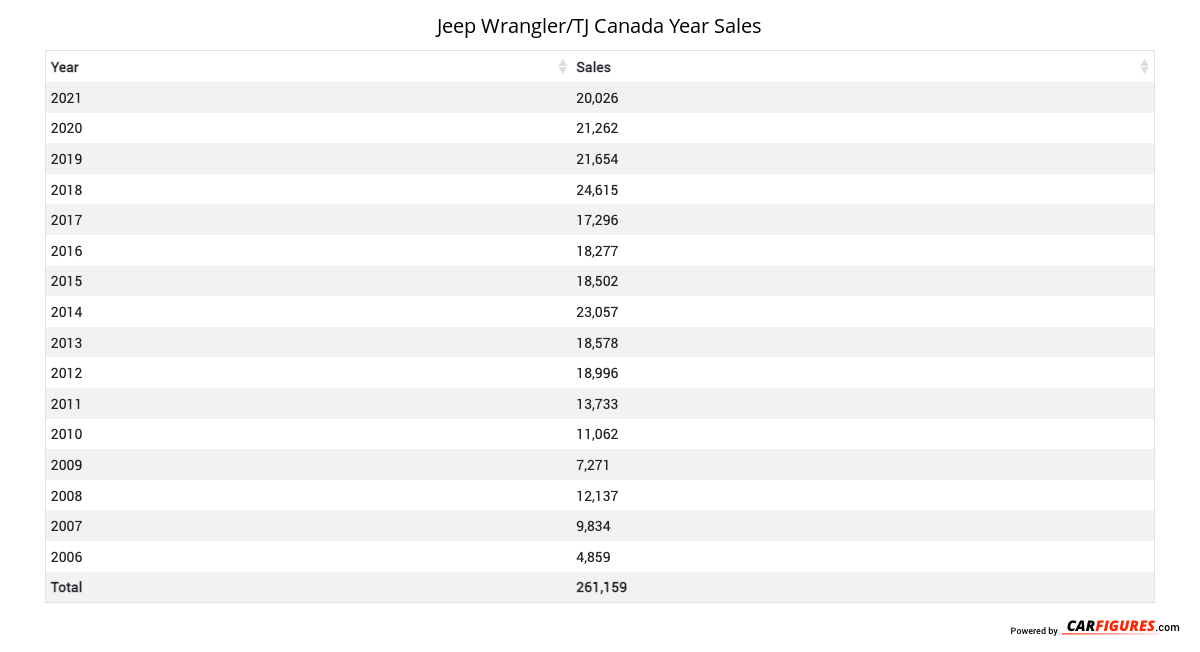
How many Wrangler/TJ did Jeep sell in 2021?
Jeep sold 20,026 Wrangler/TJ in 2021. In 2020, Jeep sold 21,262 Wrangler/TJ. They sold 1,236 more units in year 2020 compared to 2021 with a percent loss of 5.81% YoY.
Overview
The 2022 Jeep Wrangler is a vehicle from automaker Jeep.
How Much Does the 2022 Jeep Wrangler Cost?
The 2022 Jeep Wrangler starts at $38,145 MSRP. Fully loaded, the Jeep Wrangler will cost you about $55,345.
Jeep Wrangler Engine, Transmission, and Performance Numbers
Jeep Wrangler is powered by a four-wheel-drive powertrain that makes 260 horsepower and 260 ft-lb torque.
List of Jeep Wrangler Competitors
Some of Jeep Wrangler competitors include the Ford Bronco, Ford Bronco, Ford Edge, Jeep Cherokee and Ford Explorer.
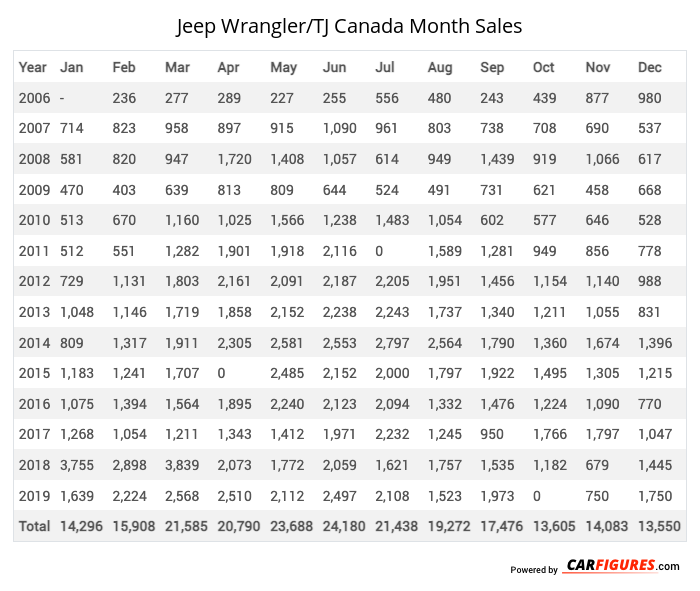
Jeep Wrangler/TJ Canadian Sale figures by year, quarter, and month are presented below. Including the most up to date sales data for the Jeep Wrangler/TJ.
Year | Jan | Feb | Mar | Apr | May | Jun | Jul | Aug | Sep | Oct | Nov | Dec |
|---|---|---|---|---|---|---|---|---|---|---|---|---|
| 2006 | - | 236 | 277 | 289 | 227 | 255 | 556 | 480 | 243 | 439 | 877 | 980 |
| 2007 | 714 | 823 | 958 | 897 | 915 | 1,090 | 961 | 803 | 738 | 708 | 690 | 537 |
| 2008 | 581 | 820 | 947 | 1,720 | 1,408 | 1,057 | 614 | 949 | 1,439 | 919 | 1,066 | 617 |
| 2009 | 470 | 403 | 639 | 813 | 809 | 644 | 524 | 491 | 731 | 621 | 458 | 668 |
| 2010 | 513 | 670 | 1,160 | 1,025 | 1,566 | 1,238 | 1,483 | 1,054 | 602 | 577 | 646 | 528 |
| 2011 | 512 | 551 | 1,282 | 1,901 | 1,918 | 2,116 | 0 | 1,589 | 1,281 | 949 | 856 | 778 |
| 2012 | 729 | 1,131 | 1,803 | 2,161 | 2,091 | 2,187 | 2,205 | 1,951 | 1,456 | 1,154 | 1,140 | 988 |
| 2013 | 1,048 | 1,146 | 1,719 | 1,858 | 2,152 | 2,238 | 2,243 | 1,737 | 1,340 | 1,211 | 1,055 | 831 |
| 2014 | 809 | 1,317 | 1,911 | 2,305 | 2,581 | 2,553 | 2,797 | 2,564 | 1,790 | 1,360 | 1,674 | 1,396 |
| 2015 | 1,183 | 1,241 | 1,707 | 0 | 2,485 | 2,152 | 2,000 | 1,797 | 1,922 | 1,495 | 1,305 | 1,215 |
| 2016 | 1,075 | 1,394 | 1,564 | 1,895 | 2,240 | 2,123 | 2,094 | 1,332 | 1,476 | 1,224 | 1,090 | 770 |
| 2017 | 1,268 | 1,054 | 1,211 | 1,343 | 1,412 | 1,971 | 2,232 | 1,245 | 950 | 1,766 | 1,797 | 1,047 |
| 2018 | 3,755 | 2,898 | 3,839 | 2,073 | 1,772 | 2,059 | 1,621 | 1,757 | 1,535 | 1,182 | 679 | 1,445 |
| 2019 | 1,639 | 2,224 | 2,568 | 2,510 | 2,112 | 2,497 | 2,108 | 1,523 | 1,973 | 0 | 750 | 1,750 |
| Total | 14,296 | 15,908 | 21,585 | 20,790 | 23,688 | 24,180 | 21,438 | 19,272 | 17,476 | 13,605 | 14,083 | 13,550 |
Year | Q1 | Q2 | Q3 | Q4 |
|---|---|---|---|---|
| 2006 | 513 | 771 | 1,279 | 2,296 |
| 2007 | 2,495 | 2,902 | 2,502 | 1,935 |
| 2008 | 2,348 | 4,185 | 3,002 | 2,602 |
| 2009 | 1,512 | 2,266 | 1,746 | 1,747 |
| 2010 | 2,343 | 3,829 | 3,139 | 1,751 |
| 2011 | 2,345 | 5,935 | 2,870 | 2,583 |
| 2012 | 3,663 | 6,439 | 5,612 | 3,282 |
| 2013 | 3,913 | 6,248 | 5,320 | 3,097 |
| 2014 | 4,037 | 7,439 | 7,151 | 4,430 |
| 2015 | 4,131 | 4,637 | 5,719 | 4,015 |
| 2016 | 4,033 | 6,258 | 4,902 | 3,084 |
| 2017 | 3,533 | 4,726 | 4,427 | 4,610 |
| 2018 | 10,492 | 5,904 | 4,913 | 3,306 |
| 2019 | 6,431 | 7,119 | 5,604 | 2,500 |
| Total | 51,789 | 68,658 | 58,186 | 41,238 |
Year | Sales |
|---|---|
| 2021 | 20,026 |
| 2020 | 21,262 |
| 2019 | 21,654 |
| 2018 | 24,615 |
| 2017 | 17,296 |
| 2016 | 18,277 |
| 2015 | 18,502 |
| 2014 | 23,057 |
| 2013 | 18,578 |
| 2012 | 18,996 |
| 2011 | 13,733 |
| 2010 | 11,062 |
| 2009 | 7,271 |
| 2008 | 12,137 |
| 2007 | 9,834 |
| 2006 | 4,859 |
| Total | 261,159 |
Download Historic Sales Data
Embedded Code
See more widgetsSources: Manufacturers