Key Stats
How many RL/RLX did Acura sell in 2021?
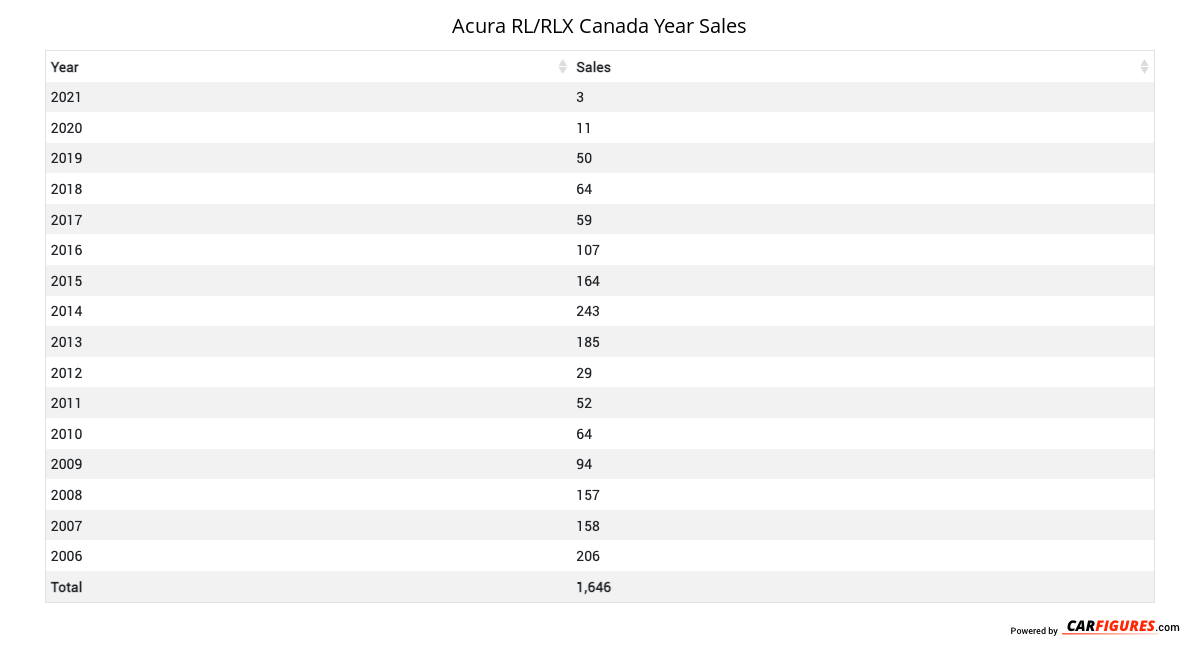
Acura sold 3 RL/RLX in 2021. In 2020, Acura sold 11 RL/RLX. They sold 8 more units in year 2020 compared to 2021 with a percent loss of 72.73% YoY.
Overview
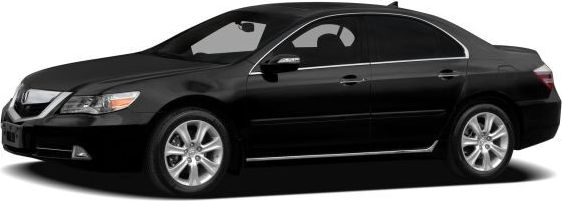
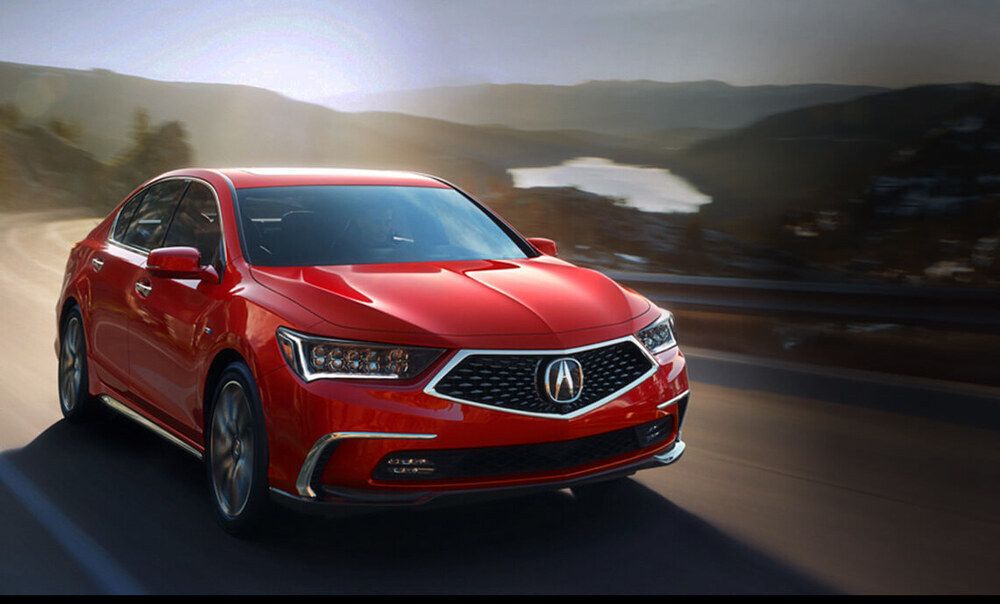
The 2012 Acura RL is a vehicle from automaker Acura.
How Much Does the 2012 Acura RL Cost?
The 2012 Acura RL starts at $64,690 MSRP.
Acura RL Engine, Transmission, and Performance Numbers
Acura RL delivers 300 horsepower with 271 ft-lb torque delivered through a all-wheel-drive drivetrain.
2012 Acura RL Fuel Economy
The 2012 Acura RL is expected to get 8 L/100 km in the city, 8 L/100 km on the highway.
List of Acura RL Competitors
Some of Acura RL competitors include the Audi A6 and Jaguar XF.
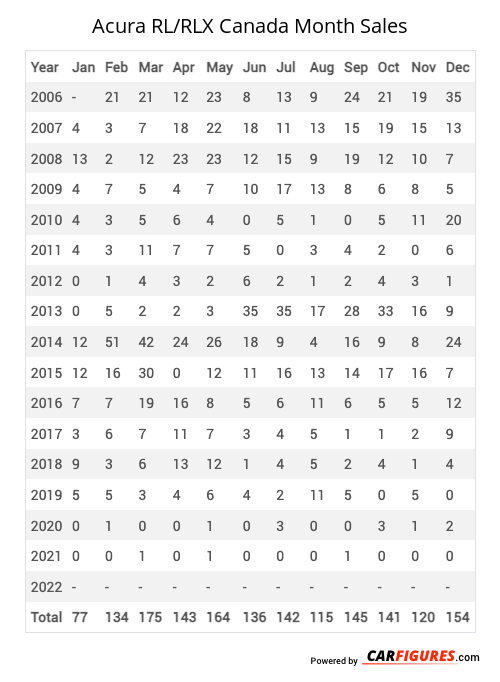
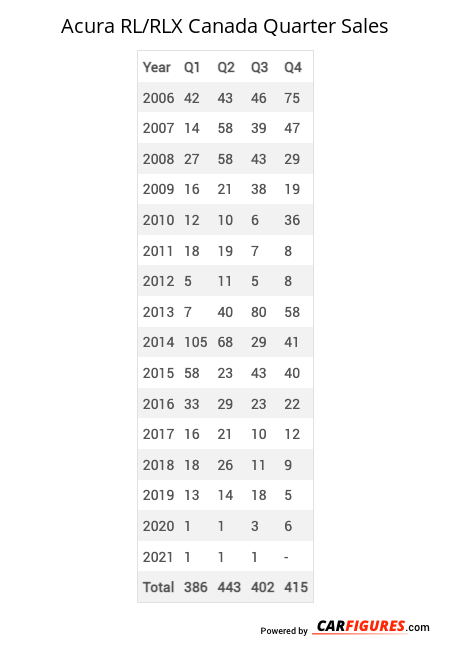
Acura RL/RLX Canadian Sale figures by year, quarter, and month are presented below. Including the most up to date sales data for the Acura RL/RLX.
Year | Jan | Feb | Mar | Apr | May | Jun | Jul | Aug | Sep | Oct | Nov | Dec |
|---|---|---|---|---|---|---|---|---|---|---|---|---|
| 2006 | - | 21 | 21 | 12 | 23 | 8 | 13 | 9 | 24 | 21 | 19 | 35 |
| 2007 | 4 | 3 | 7 | 18 | 22 | 18 | 11 | 13 | 15 | 19 | 15 | 13 |
| 2008 | 13 | 2 | 12 | 23 | 23 | 12 | 15 | 9 | 19 | 12 | 10 | 7 |
| 2009 | 4 | 7 | 5 | 4 | 7 | 10 | 17 | 13 | 8 | 6 | 8 | 5 |
| 2010 | 4 | 3 | 5 | 6 | 4 | 0 | 5 | 1 | 0 | 5 | 11 | 20 |
| 2011 | 4 | 3 | 11 | 7 | 7 | 5 | 0 | 3 | 4 | 2 | 0 | 6 |
| 2012 | 0 | 1 | 4 | 3 | 2 | 6 | 2 | 1 | 2 | 4 | 3 | 1 |
| 2013 | 0 | 5 | 2 | 2 | 3 | 35 | 35 | 17 | 28 | 33 | 16 | 9 |
| 2014 | 12 | 51 | 42 | 24 | 26 | 18 | 9 | 4 | 16 | 9 | 8 | 24 |
| 2015 | 12 | 16 | 30 | 0 | 12 | 11 | 16 | 13 | 14 | 17 | 16 | 7 |
| 2016 | 7 | 7 | 19 | 16 | 8 | 5 | 6 | 11 | 6 | 5 | 5 | 12 |
| 2017 | 3 | 6 | 7 | 11 | 7 | 3 | 4 | 5 | 1 | 1 | 2 | 9 |
| 2018 | 9 | 3 | 6 | 13 | 12 | 1 | 4 | 5 | 2 | 4 | 1 | 4 |
| 2019 | 5 | 5 | 3 | 4 | 6 | 4 | 2 | 11 | 5 | 0 | 5 | 0 |
| 2020 | 0 | 1 | 0 | 0 | 1 | 0 | 3 | 0 | 0 | 3 | 1 | 2 |
| 2021 | 0 | 0 | 1 | 0 | 1 | 0 | 0 | 0 | 1 | 0 | 0 | 0 |
| 2022 | - | - | - | - | - | - | - | - | - | - | - | - |
| Total | 77 | 134 | 175 | 143 | 164 | 136 | 142 | 115 | 145 | 141 | 120 | 154 |
Year | Q1 | Q2 | Q3 | Q4 |
|---|---|---|---|---|
| 2006 | 42 | 43 | 46 | 75 |
| 2007 | 14 | 58 | 39 | 47 |
| 2008 | 27 | 58 | 43 | 29 |
| 2009 | 16 | 21 | 38 | 19 |
| 2010 | 12 | 10 | 6 | 36 |
| 2011 | 18 | 19 | 7 | 8 |
| 2012 | 5 | 11 | 5 | 8 |
| 2013 | 7 | 40 | 80 | 58 |
| 2014 | 105 | 68 | 29 | 41 |
| 2015 | 58 | 23 | 43 | 40 |
| 2016 | 33 | 29 | 23 | 22 |
| 2017 | 16 | 21 | 10 | 12 |
| 2018 | 18 | 26 | 11 | 9 |
| 2019 | 13 | 14 | 18 | 5 |
| 2020 | 1 | 1 | 3 | 6 |
| 2021 | 1 | 1 | 1 | - |
| Total | 386 | 443 | 402 | 415 |
Year | Sales |
|---|---|
| 2021 | 3 |
| 2020 | 11 |
| 2019 | 50 |
| 2018 | 64 |
| 2017 | 59 |
| 2016 | 107 |
| 2015 | 164 |
| 2014 | 243 |
| 2013 | 185 |
| 2012 | 29 |
| 2011 | 52 |
| 2010 | 64 |
| 2009 | 94 |
| 2008 | 157 |
| 2007 | 158 |
| 2006 | 206 |
| Total | 1,646 |
Download Historic Sales Data
Looking for more data/visualizations? Send us an email at contact@carfigures.com for customized data aggregates and visualizations.Embedded Code
See more widgetsSources: Manufacturers

