Last updated: January 31, 2020
smart Total US Sales Statistics by Year
smart Total US Sales Statistics by Quarter
Discontinued Models
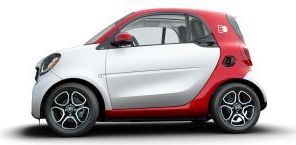
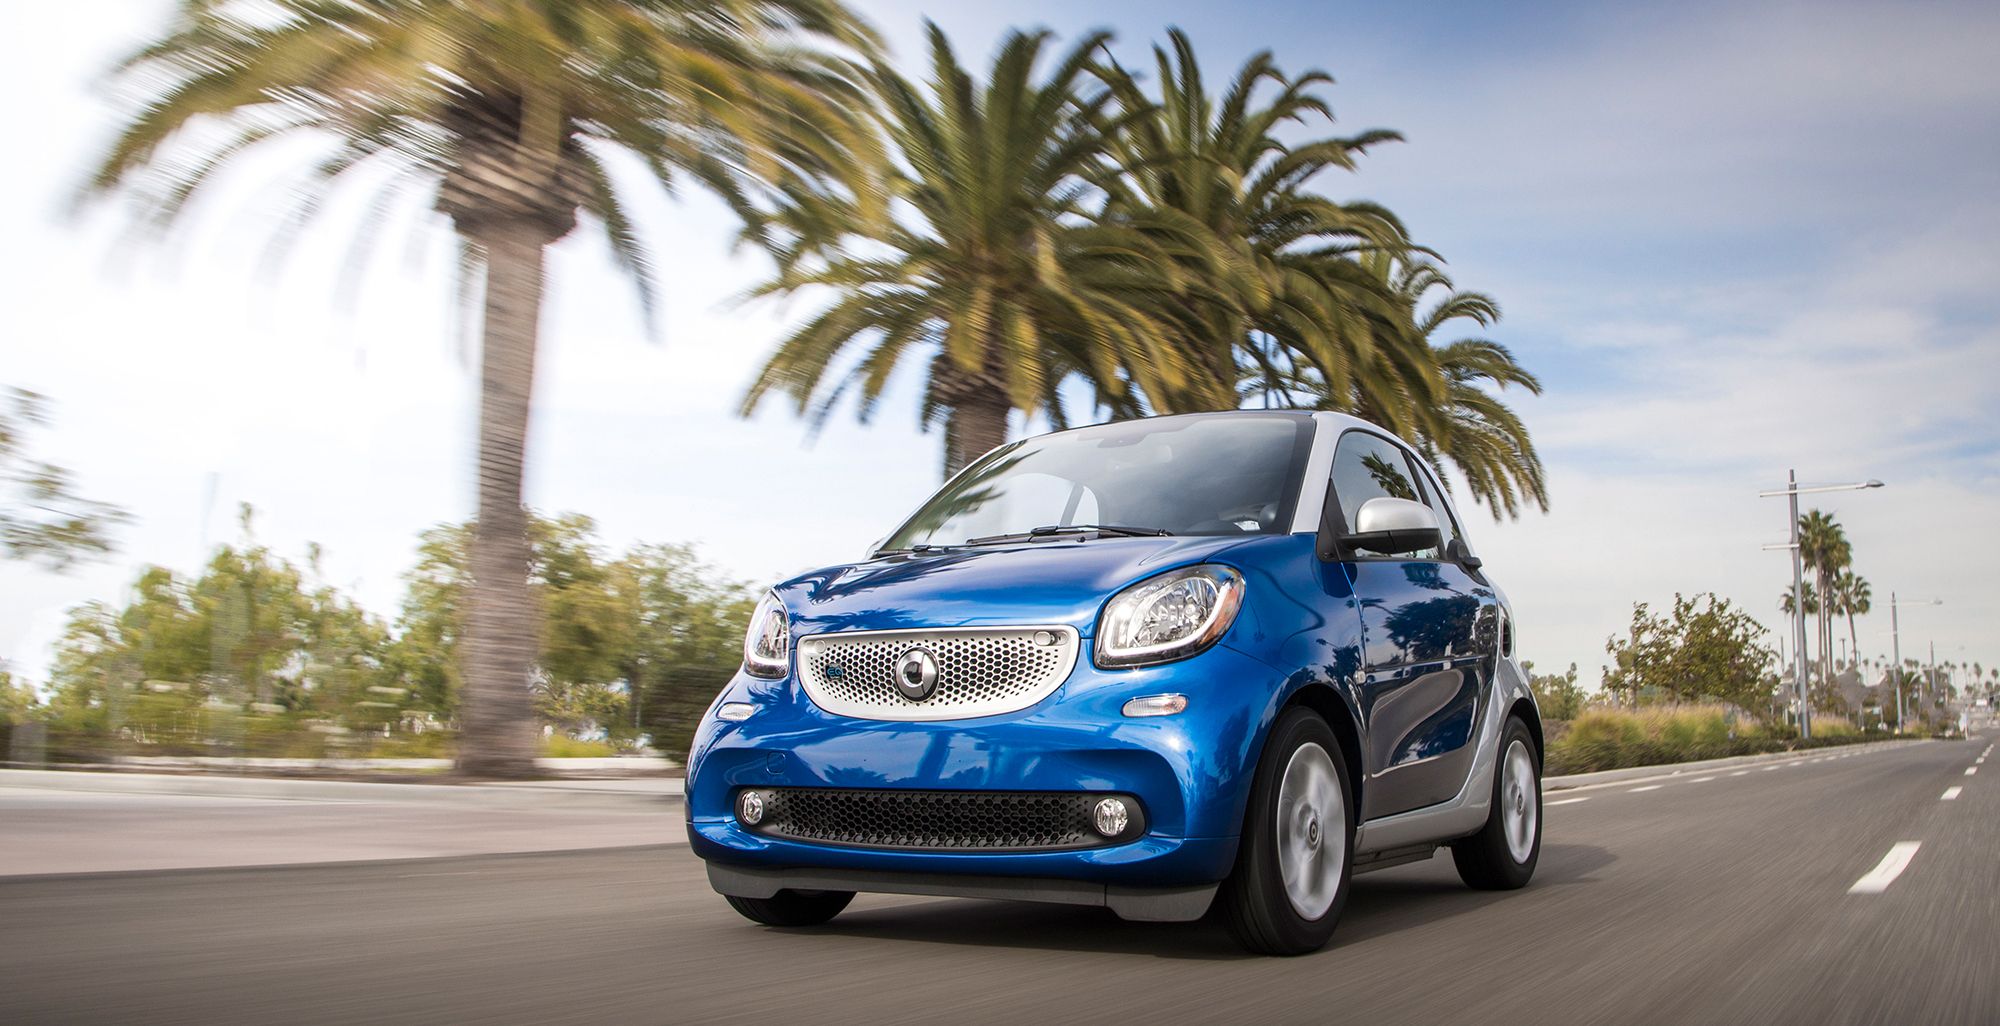
smart includes the cars 2024 smart car
Loading, please wait
Year | Q1 | Q2 | Q3 | Q4 |
|---|---|---|---|---|
| 2013 | - | 2,266 | 2,478 | 2,327 |
| 2014 | 2,237 | 2,410 | 3,433 | 2,373 |
| 2015 | 1,533 | 2,091 | 1,808 | 2,052 |
| 2016 | 1,300 | 1,293 | 1,451 | 2,167 |
| 2017 | 1,061 | 922 | 652 | 436 |
| 2018 | 321 | 329 | 309 | 317 |
| 2019 | 231 | 265 | 130 | - |
Loading, please wait
Year | Sales |
|---|---|
| 2019 | 626 |
| 2018 | 1,276 |
| 2017 | 3,071 |
| 2016 | 6,211 |
| 2015 | 7,484 |
| 2014 | 10,453 |
| 2013 | 7,071 |
| Total | 36,192 |