Last updated: January 03, 2025
Overview
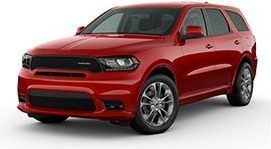
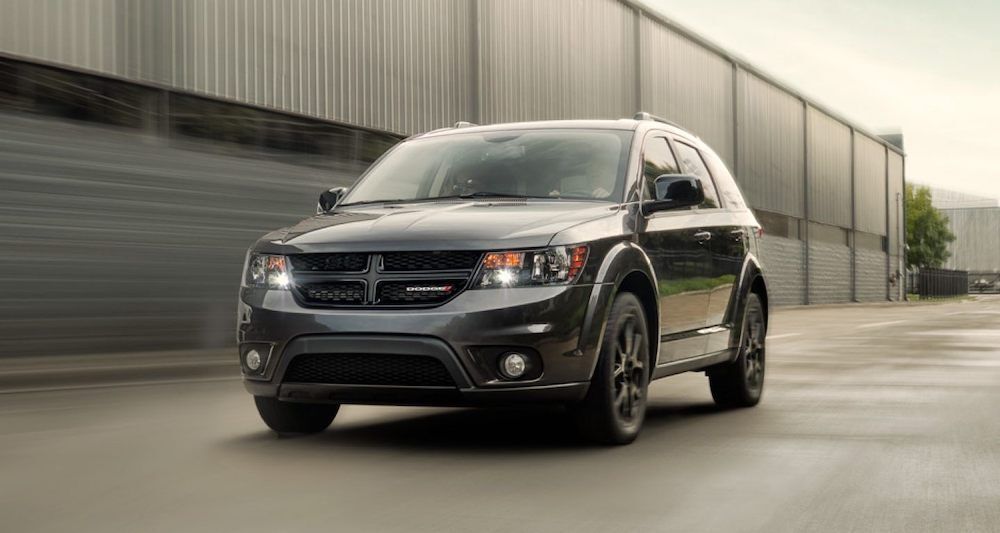
The Dodge Journey is a SUV with room for 7 people.
How Much Does the 2020 Dodge Journey Cost?
The 2020 Dodge Journey starts at $23,675 MSRP. Fully loaded, the Dodge Journey will cost you about $28,595.
Dodge Journey Engine, Transmission, and Performance Numbers
Dodge Journey is powered by a 2.4-liter I-4 engine with a FWD powertrain that makes 173 -hp and torque. The transmission on the Dodge Journey is an.
2020 Dodge Journey Fuel Economy
The 2020 Dodge Journey is expected to get 21 mpg combined.
List of Dodge Journey Competitors
Some of Dodge Journey competitors include the Kia Sorento, Mitsubishi Outlander and Volkswagen Tiguan.
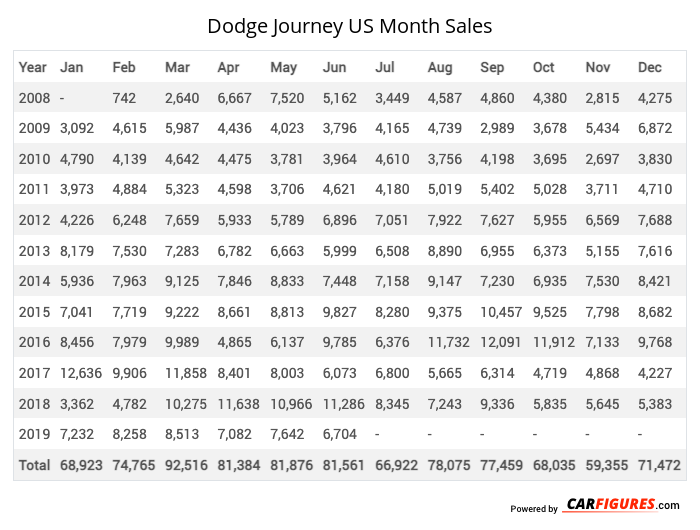
Dodge Journey United States Sale figures by year, quarter, and month are presented below. Including the most up to date sales data for the Dodge Journey. See how the Dodge Journey stacks up the other models in the Crossover/SUVS, Midsize Crossover/SUVs segments.
For sales numbers of the Dodge Journey in Canada, click here.
Loading, please wait
Year | Jan | Feb | Mar | Apr | May | Jun | Jul | Aug | Sep | Oct | Nov | Dec |
|---|---|---|---|---|---|---|---|---|---|---|---|---|
| 2008 | - | 742 | 2,640 | 6,667 | 7,520 | 5,162 | 3,449 | 4,587 | 4,860 | 4,380 | 2,815 | 4,275 |
| 2009 | 3,092 | 4,615 | 5,987 | 4,436 | 4,023 | 3,796 | 4,165 | 4,739 | 2,989 | 3,678 | 5,434 | 6,872 |
| 2010 | 4,790 | 4,139 | 4,642 | 4,475 | 3,781 | 3,964 | 4,610 | 3,756 | 4,198 | 3,695 | 2,697 | 3,830 |
| 2011 | 3,973 | 4,884 | 5,323 | 4,598 | 3,706 | 4,621 | 4,180 | 5,019 | 5,402 | 5,028 | 3,711 | 4,710 |
| 2012 | 4,226 | 6,248 | 7,659 | 5,933 | 5,789 | 6,896 | 7,051 | 7,922 | 7,627 | 5,955 | 6,569 | 7,688 |
| 2013 | 8,179 | 7,530 | 7,283 | 6,782 | 6,663 | 5,999 | 6,508 | 8,890 | 6,955 | 6,373 | 5,155 | 7,616 |
| 2014 | 5,936 | 7,963 | 9,125 | 7,846 | 8,833 | 7,448 | 7,158 | 9,147 | 7,230 | 6,935 | 7,530 | 8,421 |
| 2015 | 7,041 | 7,719 | 9,222 | 8,661 | 8,813 | 9,827 | 8,280 | 9,375 | 10,457 | 9,525 | 7,798 | 8,682 |
| 2016 | 8,456 | 7,979 | 9,989 | 4,865 | 6,137 | 9,785 | 6,376 | 11,732 | 12,091 | 11,912 | 7,133 | 9,768 |
| 2017 | 12,636 | 9,906 | 11,858 | 8,401 | 8,003 | 6,073 | 6,800 | 5,665 | 6,314 | 4,719 | 4,868 | 4,227 |
| 2018 | 3,362 | 4,782 | 10,275 | 11,638 | 10,966 | 11,286 | 8,345 | 7,243 | 9,336 | 5,835 | 5,645 | 5,383 |
| 2019 | 7,232 | 8,258 | 8,513 | 7,082 | 7,642 | 6,704 | - | - | - | - | - | - |
| Total | 68,923 | 74,765 | 92,516 | 81,384 | 81,876 | 81,561 | 66,922 | 78,075 | 77,459 | 68,035 | 59,355 | 71,472 |
Loading, please wait
Year | Q1 | Q2 | Q3 | Q4 |
|---|---|---|---|---|
| 2008 | 3,382 | 19,349 | 12,896 | 11,470 |
| 2009 | 13,694 | 12,255 | 11,893 | 15,984 |
| 2010 | 13,571 | 12,220 | 12,564 | 10,222 |
| 2011 | 14,180 | 12,925 | 14,601 | 13,449 |
| 2012 | 18,133 | 18,618 | 22,600 | 20,212 |
| 2013 | 22,992 | 19,444 | 22,353 | 19,144 |
| 2014 | 23,024 | 24,127 | 23,535 | 22,886 |
| 2015 | 23,982 | 27,301 | 28,112 | 26,005 |
| 2016 | 26,424 | 20,787 | 30,199 | 28,813 |
| 2017 | 34,400 | 22,477 | 18,779 | 13,814 |
| 2018 | 18,419 | 33,890 | 24,924 | 16,863 |
| 2019 | 24,003 | 21,428 | 16,965 | 12,290 |
| 2020 | 15,152 | 5,434 | 10,164 | 9,592 |
| 2021 | 6,880 | 5,885 | 1,062 | 208 |
| 2022 | 112 | 45 | 31 | 6 |
| 2023 | 9 | 0 | 0 | 0 |
| 2024 | 0 | 0 | 0 | 0 |
| 2025 | - | - | - | - |
| Total | 258,357 | 256,185 | 250,678 | 220,958 |
Loading, please wait
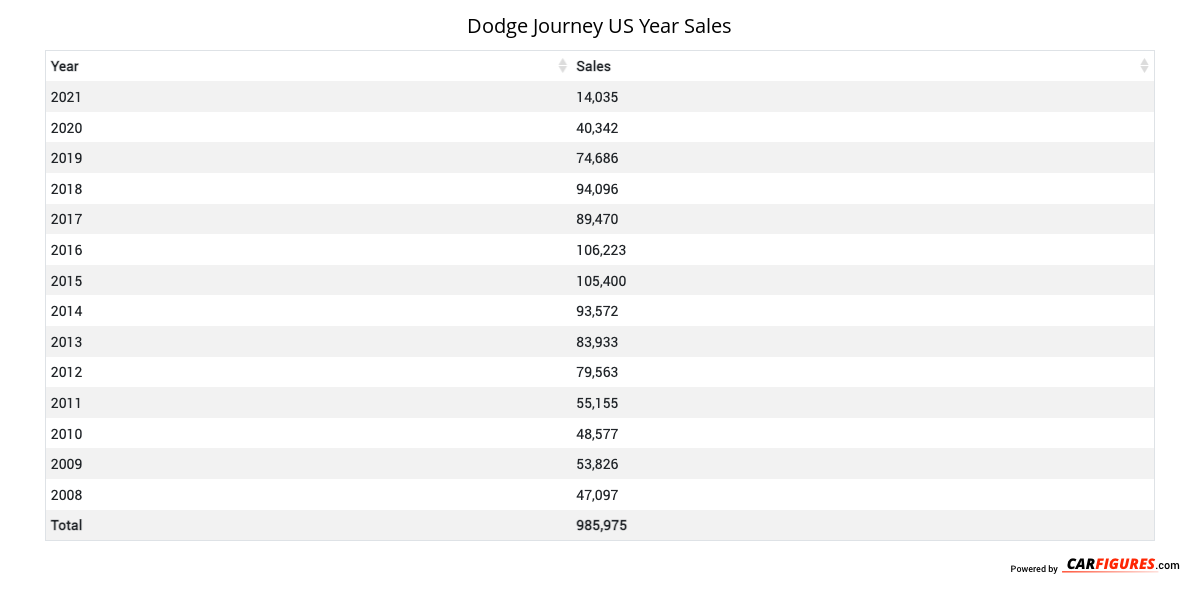
Year | Sales |
|---|---|
| 2023 | 9 |
| 2022 | 194 |
| 2021 | 14,035 |
| 2020 | 40,342 |
| 2019 | 74,686 |
| 2018 | 94,096 |
| 2017 | 89,470 |
| 2016 | 106,223 |
| 2015 | 105,400 |
| 2014 | 93,572 |
| 2013 | 83,933 |
| 2012 | 79,563 |
| 2011 | 55,155 |
| 2010 | 48,577 |
| 2009 | 53,826 |
| 2008 | 47,097 |
| Total | 986,178 |
Download Historic Sales Data

Embedded Code
See more widgetsSources: Manufacturers