Overview
The Chrysler 200 is a Sedan with room for 5 people.
Chrysler 200 Engine, Transmission, and Performance Numbers
Chrysler 200 includes a 2.4-liter I-4 engine combined with a 9-speed automatic. This delivers 184 hp with 173 lbs.-ft. Torque delivered through a FWD drivetrain.
2017 Chrysler 200 Fuel Economy
The 2017 Chrysler 200 can hold 15 gallons of fuel.
2017 Chrysler 200 Specifications
The has a curb weight of 3,473 lbs. With an interior passenger volume of 101.4 cu. Ft.
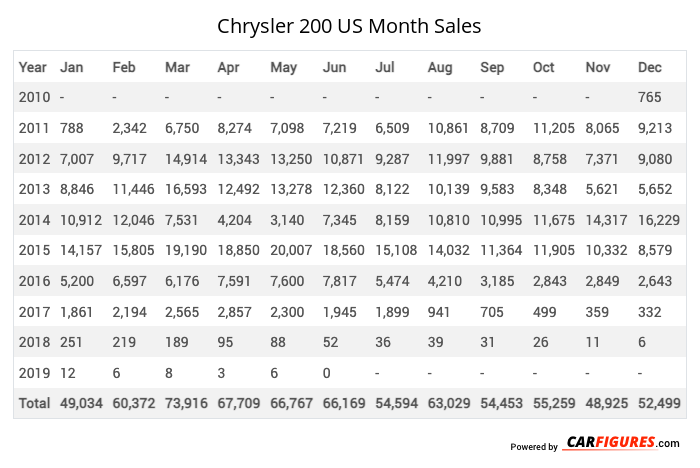
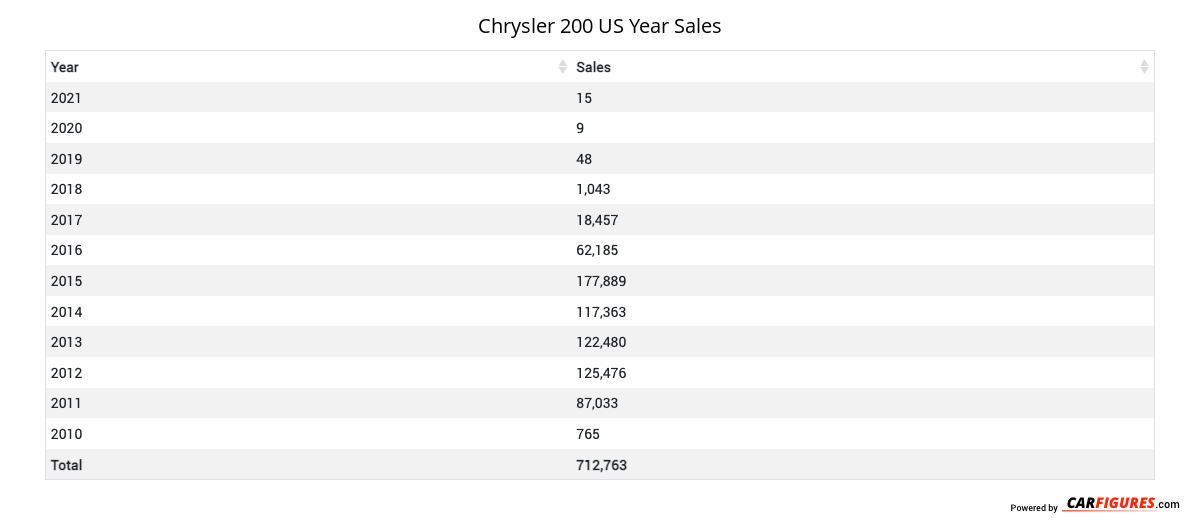
Chrysler 200 United States Sale figures by year, quarter, and month are presented below. Including the most up to date sales data for the Chrysler 200. See how the Chrysler 200 stacks up the other models in the Cars, Midsize Cars segments.
For sales numbers of the Chrysler 200 in Canada, click here.
Loading, please wait
Year | Jan | Feb | Mar | Apr | May | Jun | Jul | Aug | Sep | Oct | Nov | Dec |
|---|---|---|---|---|---|---|---|---|---|---|---|---|
| 2010 | - | - | - | - | - | - | - | - | - | - | - | 765 |
| 2011 | 788 | 2,342 | 6,750 | 8,274 | 7,098 | 7,219 | 6,509 | 10,861 | 8,709 | 11,205 | 8,065 | 9,213 |
| 2012 | 7,007 | 9,717 | 14,914 | 13,343 | 13,250 | 10,871 | 9,287 | 11,997 | 9,881 | 8,758 | 7,371 | 9,080 |
| 2013 | 8,846 | 11,446 | 16,593 | 12,492 | 13,278 | 12,360 | 8,122 | 10,139 | 9,583 | 8,348 | 5,621 | 5,652 |
| 2014 | 10,912 | 12,046 | 7,531 | 4,204 | 3,140 | 7,345 | 8,159 | 10,810 | 10,995 | 11,675 | 14,317 | 16,229 |
| 2015 | 14,157 | 15,805 | 19,190 | 18,850 | 20,007 | 18,560 | 15,108 | 14,032 | 11,364 | 11,905 | 10,332 | 8,579 |
| 2016 | 5,200 | 6,597 | 6,176 | 7,591 | 7,600 | 7,817 | 5,474 | 4,210 | 3,185 | 2,843 | 2,849 | 2,643 |
| 2017 | 1,861 | 2,194 | 2,565 | 2,857 | 2,300 | 1,945 | 1,899 | 941 | 705 | 499 | 359 | 332 |
| 2018 | 251 | 219 | 189 | 95 | 88 | 52 | 36 | 39 | 31 | 26 | 11 | 6 |
| 2019 | 12 | 6 | 8 | 3 | 6 | 0 | - | - | - | - | - | - |
| Total | 49,034 | 60,372 | 73,916 | 67,709 | 66,767 | 66,169 | 54,594 | 63,029 | 54,453 | 55,259 | 48,925 | 52,499 |
Loading, please wait
Year | Q1 | Q2 | Q3 | Q4 |
|---|---|---|---|---|
| 2010 | - | - | - | 765 |
| 2011 | 9,880 | 22,591 | 26,079 | 28,483 |
| 2012 | 31,638 | 37,464 | 31,165 | 25,209 |
| 2013 | 36,885 | 38,130 | 27,844 | 19,621 |
| 2014 | 30,489 | 14,689 | 29,964 | 42,221 |
| 2015 | 49,152 | 57,417 | 40,504 | 30,816 |
| 2016 | 17,973 | 23,008 | 12,869 | 8,335 |
| 2017 | 6,620 | 7,102 | 3,545 | 1,190 |
| 2018 | 659 | 235 | 106 | 43 |
| 2019 | 26 | 9 | 10 | 3 |
| 2020 | 3 | 0 | 4 | 2 |
| 2021 | 1 | 2 | 2 | 10 |
| 2022 | 3 | 0 | 0 | 0 |
| 2023 | 0 | 0 | 0 | 0 |
| 2024 | 0 | 0 | 0 | 0 |
| 2025 | - | - | - | - |
| Total | 183,329 | 200,647 | 172,092 | 156,698 |
Loading, please wait
Year | Sales |
|---|---|
| 2022 | 3 |
| 2021 | 15 |
| 2020 | 9 |
| 2019 | 48 |
| 2018 | 1,043 |
| 2017 | 18,457 |
| 2016 | 62,185 |
| 2015 | 177,889 |
| 2014 | 117,363 |
| 2013 | 122,480 |
| 2012 | 125,476 |
| 2011 | 87,033 |
| 2010 | 765 |
| Total | 712,766 |
Download Historic Sales Data

Embedded Code
See more widgetsSources: Manufacturers