Key Stats
How many Corolla did Toyota sell in 2020?
Toyota sold 181,360 Corolla in 2020. (From Jan - Dec 2020)
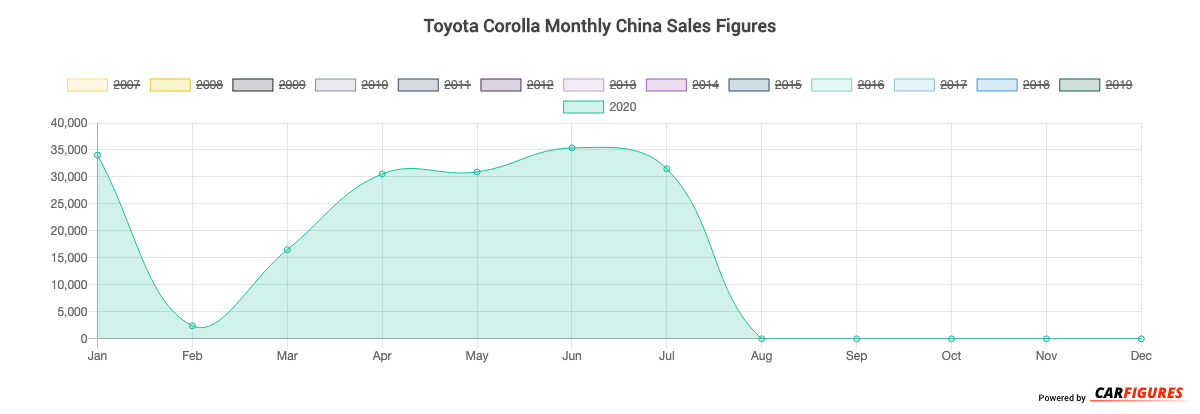
How many Corolla did Toyota sell in July 2020?
Toyota sold 31,517 Corolla in July 2020.
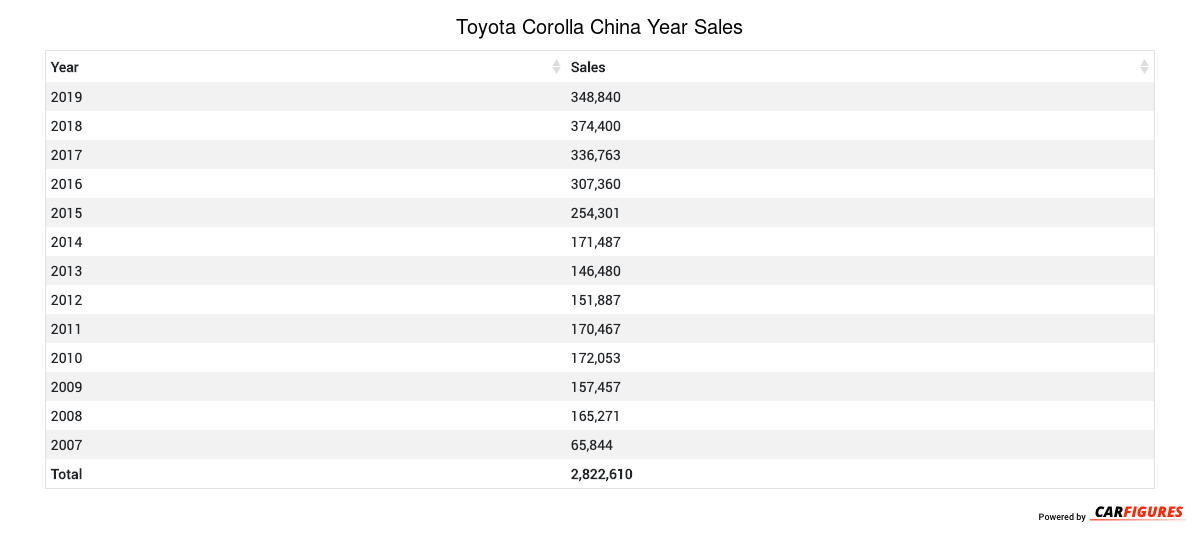
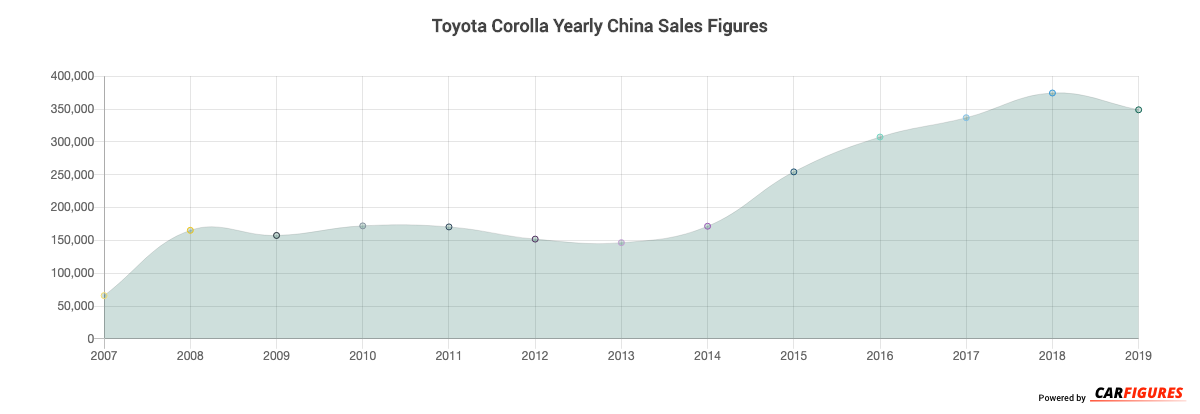
How many Corolla did Toyota sell in 2019?
Toyota sold 348,840 Corolla in 2019. In 2018, Toyota sold 374,400 Corolla. They sold 25,560 more units in year 2018 compared to 2019 with a percent loss of 6.83% YoY.
Overview
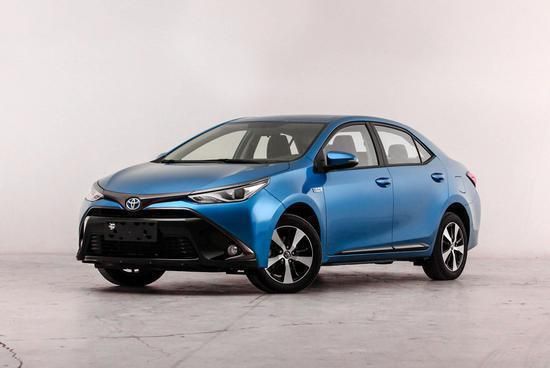
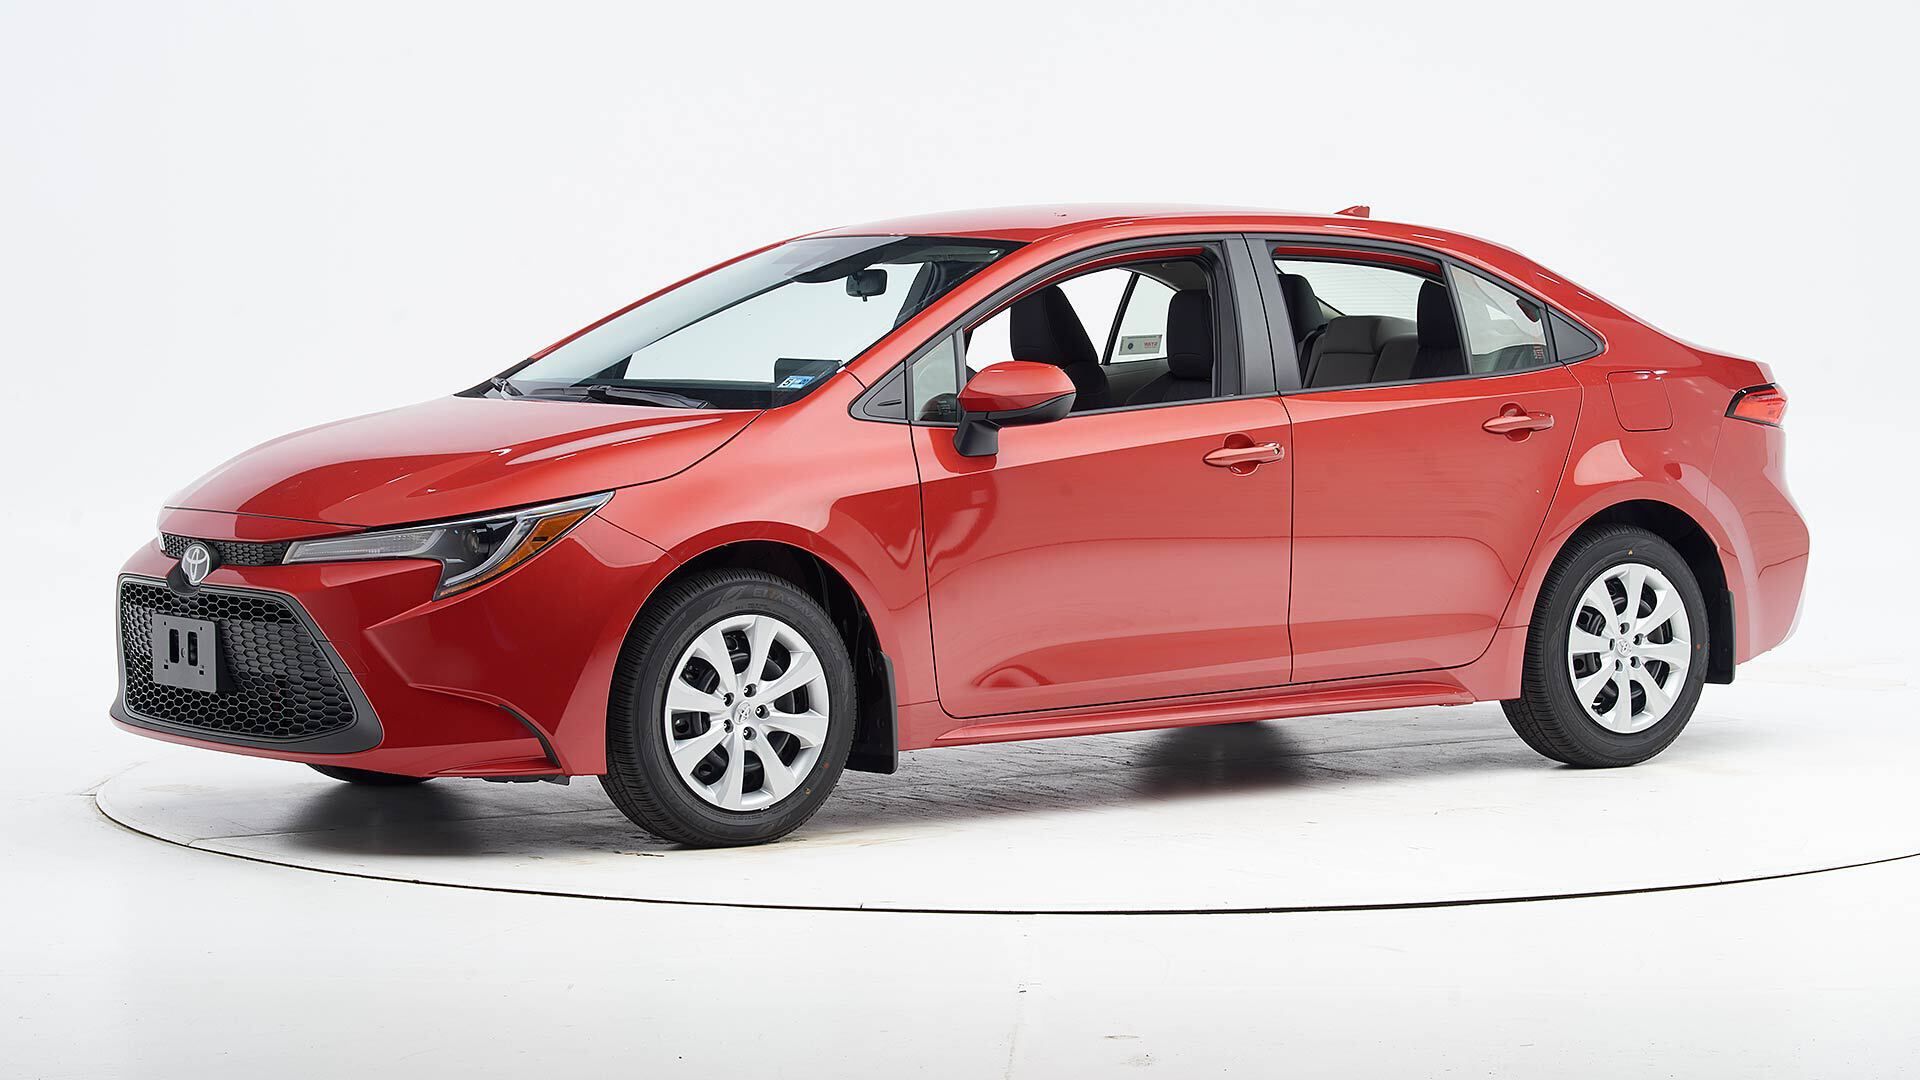
The Corolla is a 4-door 5-seater sedan with room for 5 people from automaker Toyota.
How Much Does the Toyota Corolla Cost?
Pricing for the Corolla starts at CN¥119,800 Yuan ($16,772 USD) MSRP and goes up to CN¥159,800 Yuan ($22,372 USD) fully equipped.
Toyota Corolla Engine and Performance
Corolla is powered by a 1.2T L engine that makes 72 Kw (96.55 HP) - 85 Kw (113.99 HP) and 142 Nm (105.08 ft-lb) - 185 Nm (136.90 ft-lb) torque.
Toyota Corolla Specifications
The Corolla has a curb weight of 1,300 kg (2,900 lbs) - 1,400 kg (3,200 lbs).
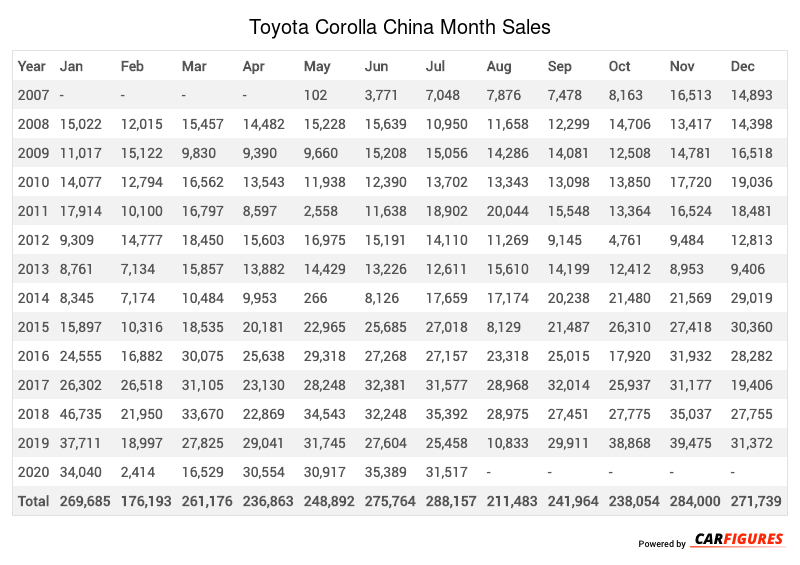
Toyota Corolla China Sale figures by year, quarter, and month are presented below. Including the most up to date sales data for the Toyota Corolla.
Year | Jan | Feb | Mar | Apr | May | Jun | Jul | Aug | Sep | Oct | Nov | Dec |
|---|---|---|---|---|---|---|---|---|---|---|---|---|
| 2007 | - | - | - | - | 102 | 3,771 | 7,048 | 7,876 | 7,478 | 8,163 | 16,513 | 14,893 |
| 2008 | 15,022 | 12,015 | 15,457 | 14,482 | 15,228 | 15,639 | 10,950 | 11,658 | 12,299 | 14,706 | 13,417 | 14,398 |
| 2009 | 11,017 | 15,122 | 9,830 | 9,390 | 9,660 | 15,208 | 15,056 | 14,286 | 14,081 | 12,508 | 14,781 | 16,518 |
| 2010 | 14,077 | 12,794 | 16,562 | 13,543 | 11,938 | 12,390 | 13,702 | 13,343 | 13,098 | 13,850 | 17,720 | 19,036 |
| 2011 | 17,914 | 10,100 | 16,797 | 8,597 | 2,558 | 11,638 | 18,902 | 20,044 | 15,548 | 13,364 | 16,524 | 18,481 |
| 2012 | 9,309 | 14,777 | 18,450 | 15,603 | 16,975 | 15,191 | 14,110 | 11,269 | 9,145 | 4,761 | 9,484 | 12,813 |
| 2013 | 8,761 | 7,134 | 15,857 | 13,882 | 14,429 | 13,226 | 12,611 | 15,610 | 14,199 | 12,412 | 8,953 | 9,406 |
| 2014 | 8,345 | 7,174 | 10,484 | 9,953 | 266 | 8,126 | 17,659 | 17,174 | 20,238 | 21,480 | 21,569 | 29,019 |
| 2015 | 15,897 | 10,316 | 18,535 | 20,181 | 22,965 | 25,685 | 27,018 | 8,129 | 21,487 | 26,310 | 27,418 | 30,360 |
| 2016 | 24,555 | 16,882 | 30,075 | 25,638 | 29,318 | 27,268 | 27,157 | 23,318 | 25,015 | 17,920 | 31,932 | 28,282 |
| 2017 | 26,302 | 26,518 | 31,105 | 23,130 | 28,248 | 32,381 | 31,577 | 28,968 | 32,014 | 25,937 | 31,177 | 19,406 |
| 2018 | 46,735 | 21,950 | 33,670 | 22,869 | 34,543 | 32,248 | 35,392 | 28,975 | 27,451 | 27,775 | 35,037 | 27,755 |
| 2019 | 37,711 | 18,997 | 27,825 | 29,041 | 31,745 | 27,604 | 25,458 | 10,833 | 29,911 | 38,868 | 39,475 | 31,372 |
| 2020 | 34,040 | 2,414 | 16,529 | 30,554 | 30,917 | 35,389 | 31,517 | - | - | - | - | - |
| Total | 269,685 | 176,193 | 261,176 | 236,863 | 248,892 | 275,764 | 288,157 | 211,483 | 241,964 | 238,054 | 284,000 | 271,739 |
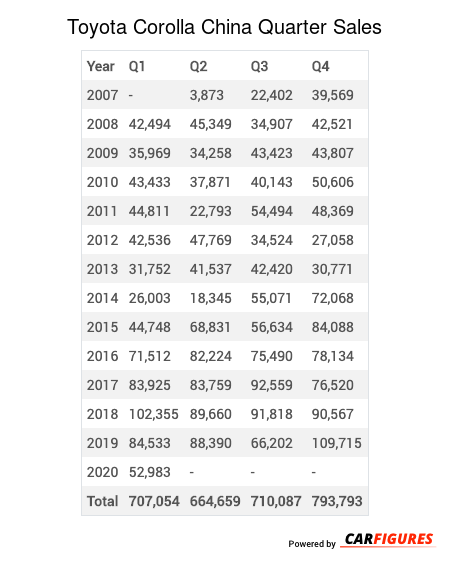
Year | Q1 | Q2 | Q3 | Q4 |
|---|---|---|---|---|
| 2007 | - | 3,873 | 22,402 | 39,569 |
| 2008 | 42,494 | 45,349 | 34,907 | 42,521 |
| 2009 | 35,969 | 34,258 | 43,423 | 43,807 |
| 2010 | 43,433 | 37,871 | 40,143 | 50,606 |
| 2011 | 44,811 | 22,793 | 54,494 | 48,369 |
| 2012 | 42,536 | 47,769 | 34,524 | 27,058 |
| 2013 | 31,752 | 41,537 | 42,420 | 30,771 |
| 2014 | 26,003 | 18,345 | 55,071 | 72,068 |
| 2015 | 44,748 | 68,831 | 56,634 | 84,088 |
| 2016 | 71,512 | 82,224 | 75,490 | 78,134 |
| 2017 | 83,925 | 83,759 | 92,559 | 76,520 |
| 2018 | 102,355 | 89,660 | 91,818 | 90,567 |
| 2019 | 84,533 | 88,390 | 66,202 | 109,715 |
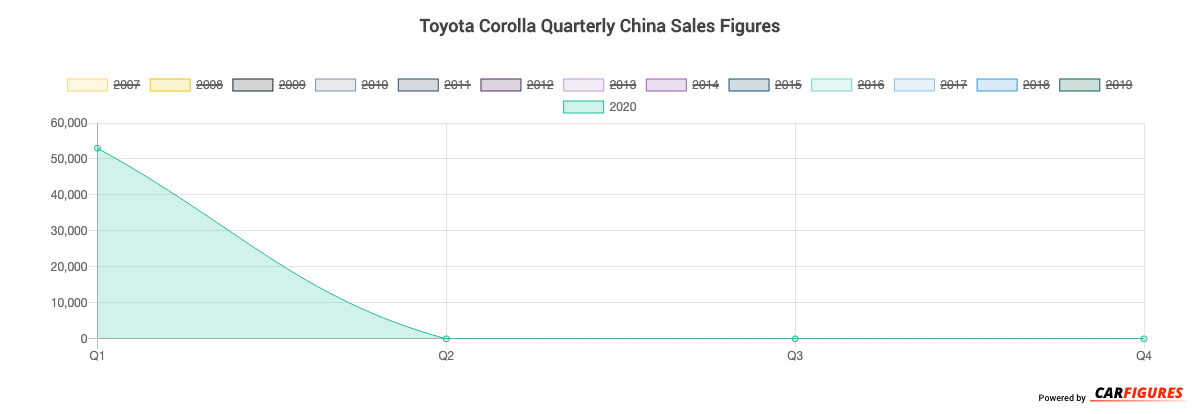
| 2020 | 52,983 | - | - | - |
| Total | 707,054 | 664,659 | 710,087 | 793,793 |
Year | Sales |
|---|---|
| 2020 | 52,983 |
| 2019 | 348,840 |
| 2018 | 374,400 |
| 2017 | 336,763 |
| 2016 | 307,360 |
| 2015 | 254,301 |
| 2014 | 171,487 |
| 2013 | 146,480 |
| 2012 | 151,887 |
| 2011 | 170,467 |
| 2010 | 172,053 |
| 2009 | 157,457 |
| 2008 | 165,271 |
| 2007 | 65,844 |
| Total | 2,875,593 |
Download Historic Sales Data
Embedded Code
See more widgetsSources: Manufacturers