Last updated: May 15, 2020
Key Stats
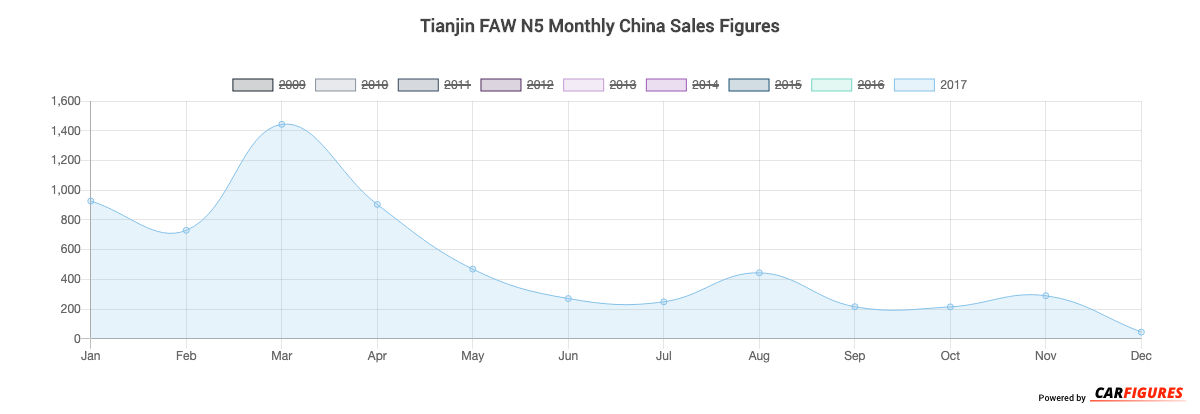
How many N5 did Tianjin FAW sell in December 2017?
Tianjin FAW sold 45 N5 in December 2017.
Overview
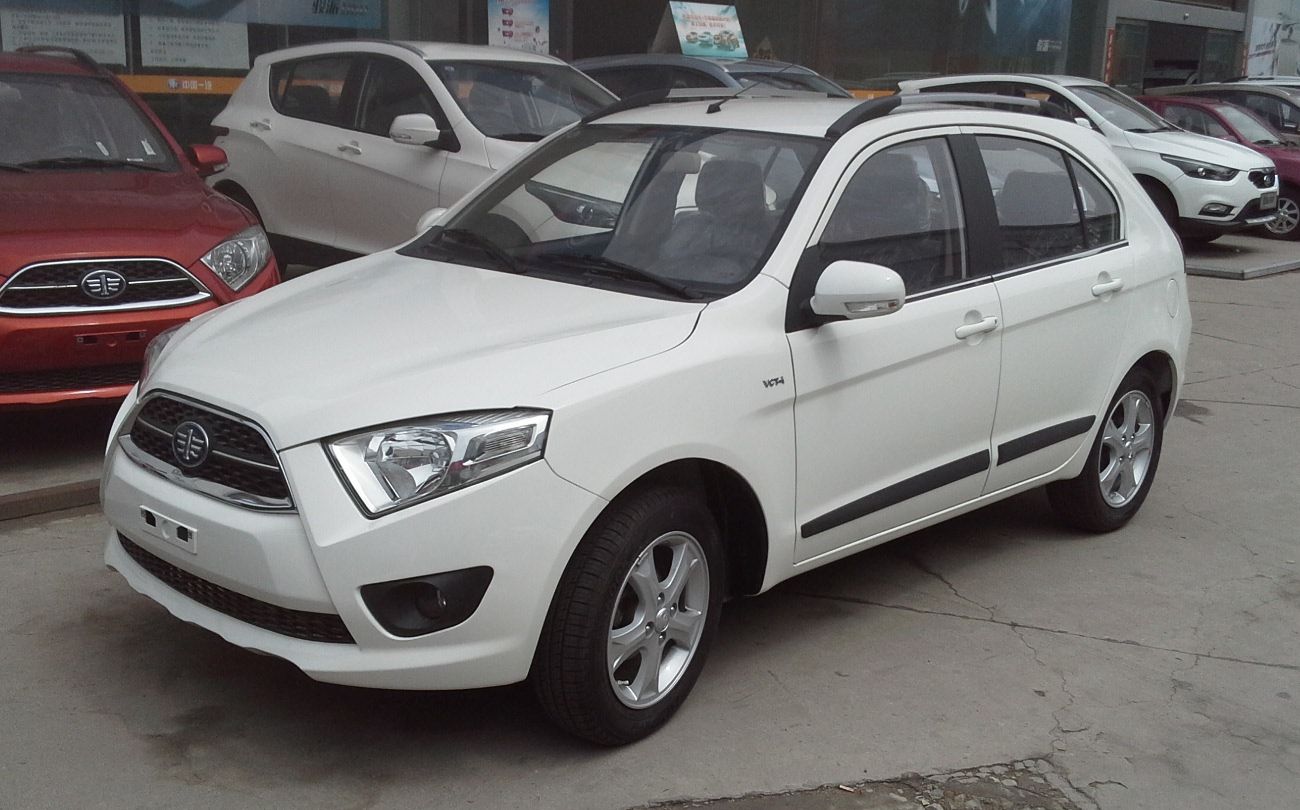
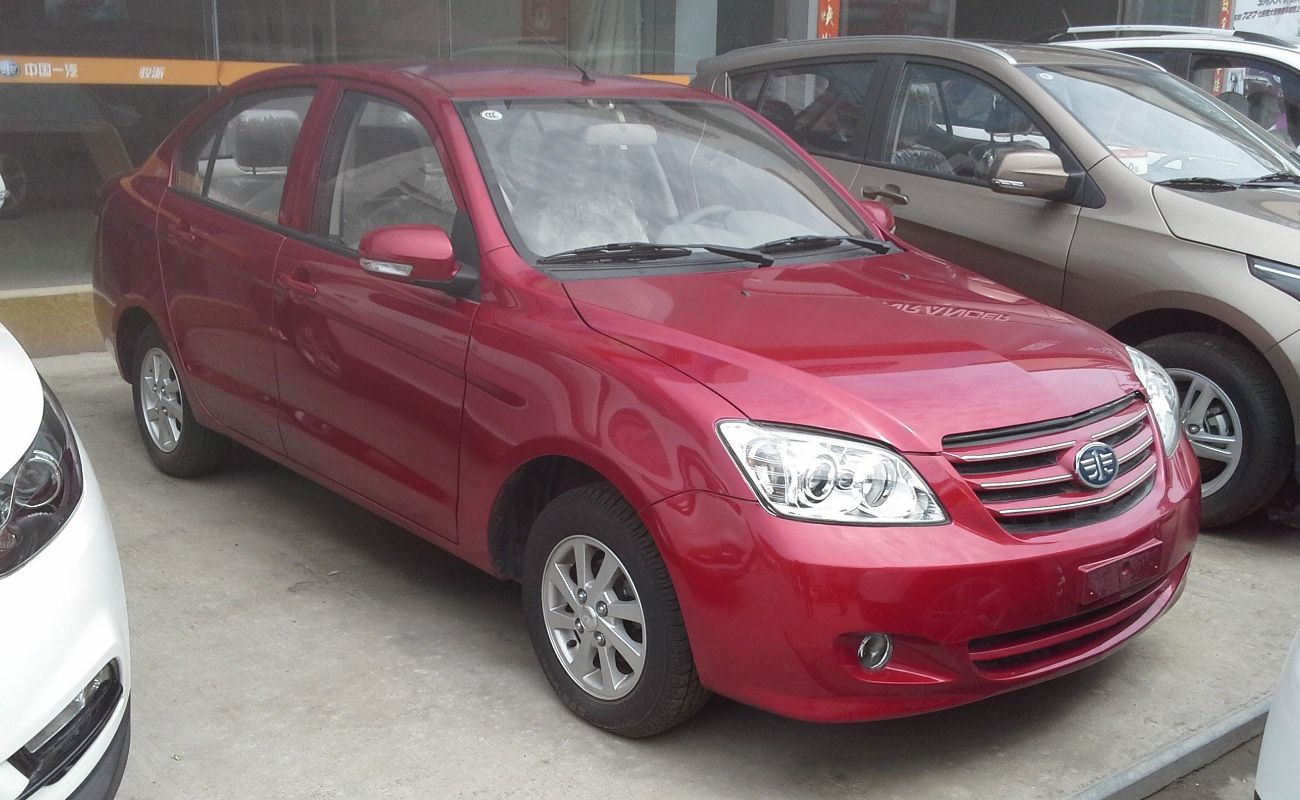
The N5 is a 4-door 5-seater sedan with room for 5 people from automaker Tianjin FAW.
How Much Does the Tianjin FAW N5 Cost?
Pricing for the N5 starts at CN¥38,900 Yuan ($5,446 USD) MSRP and goes up to CN¥51,900 Yuan ($7,266 USD) fully equipped.
Tianjin FAW N5 Engine and Performance
N5 includes a 1.0LL engine. This delivers 50. 5 Kw (67. 72 HP) - 67 Kw (89.85 HP) and 90 Nm (66.60 ft-lb) - 120 Nm (88.80 ft-lb) torque.
Tianjin FAW N5 Specifications
The N5 has a curb weight of 910 kg (2,000 lbs) - 950 kg (2,100 lbs).
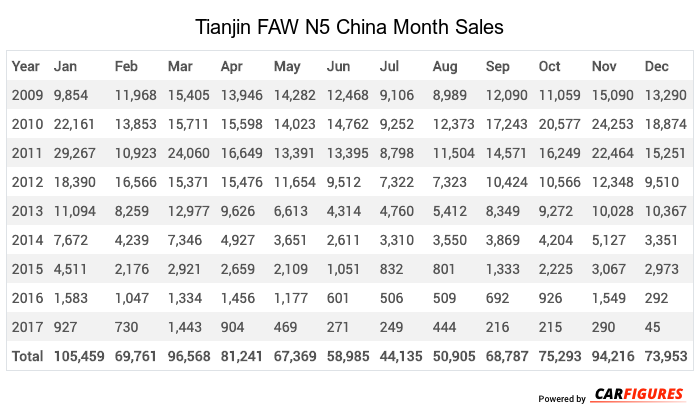
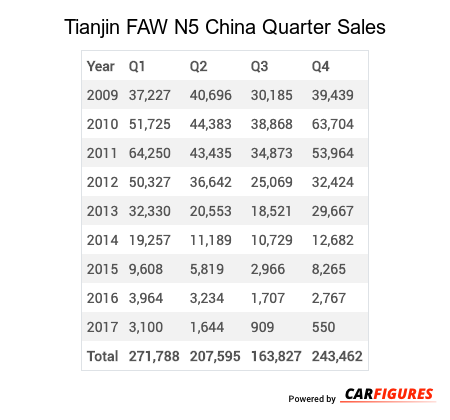
Tianjin FAW N5 China Sale figures by year, quarter, and month are presented below. Including the most up to date sales data for the Tianjin FAW N5.
Loading, please wait
Year | Jan | Feb | Mar | Apr | May | Jun | Jul | Aug | Sep | Oct | Nov | Dec |
|---|---|---|---|---|---|---|---|---|---|---|---|---|
| 2009 | 9,854 | 11,968 | 15,405 | 13,946 | 14,282 | 12,468 | 9,106 | 8,989 | 12,090 | 11,059 | 15,090 | 13,290 |
| 2010 | 22,161 | 13,853 | 15,711 | 15,598 | 14,023 | 14,762 | 9,252 | 12,373 | 17,243 | 20,577 | 24,253 | 18,874 |
| 2011 | 29,267 | 10,923 | 24,060 | 16,649 | 13,391 | 13,395 | 8,798 | 11,504 | 14,571 | 16,249 | 22,464 | 15,251 |
| 2012 | 18,390 | 16,566 | 15,371 | 15,476 | 11,654 | 9,512 | 7,322 | 7,323 | 10,424 | 10,566 | 12,348 | 9,510 |
| 2013 | 11,094 | 8,259 | 12,977 | 9,626 | 6,613 | 4,314 | 4,760 | 5,412 | 8,349 | 9,272 | 10,028 | 10,367 |
| 2014 | 7,672 | 4,239 | 7,346 | 4,927 | 3,651 | 2,611 | 3,310 | 3,550 | 3,869 | 4,204 | 5,127 | 3,351 |
| 2015 | 4,511 | 2,176 | 2,921 | 2,659 | 2,109 | 1,051 | 832 | 801 | 1,333 | 2,225 | 3,067 | 2,973 |
| 2016 | 1,583 | 1,047 | 1,334 | 1,456 | 1,177 | 601 | 506 | 509 | 692 | 926 | 1,549 | 292 |
| 2017 | 927 | 730 | 1,443 | 904 | 469 | 271 | 249 | 444 | 216 | 215 | 290 | 45 |
| Total | 105,459 | 69,761 | 96,568 | 81,241 | 67,369 | 58,985 | 44,135 | 50,905 | 68,787 | 75,293 | 94,216 | 73,953 |
Loading, please wait
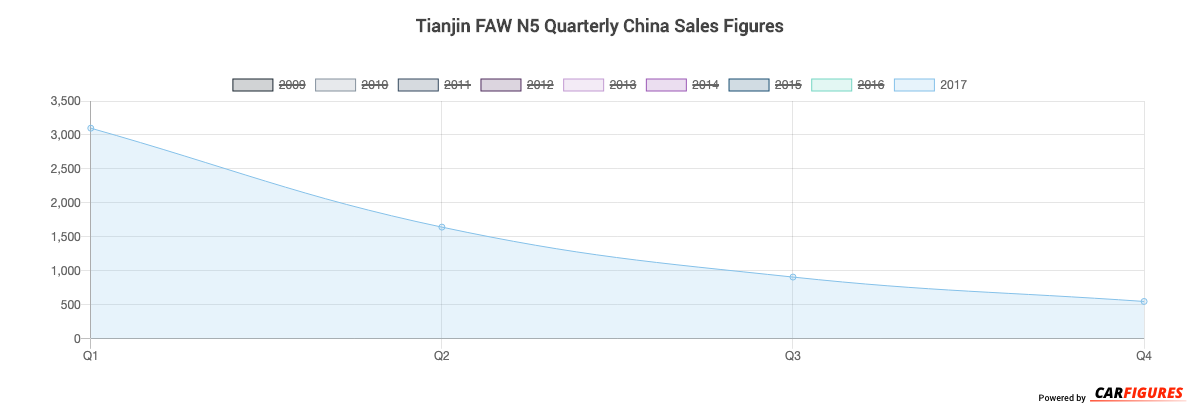
Year | Q1 | Q2 | Q3 | Q4 |
|---|---|---|---|---|
| 2009 | 37,227 | 40,696 | 30,185 | 39,439 |
| 2010 | 51,725 | 44,383 | 38,868 | 63,704 |
| 2011 | 64,250 | 43,435 | 34,873 | 53,964 |
| 2012 | 50,327 | 36,642 | 25,069 | 32,424 |
| 2013 | 32,330 | 20,553 | 18,521 | 29,667 |
| 2014 | 19,257 | 11,189 | 10,729 | 12,682 |
| 2015 | 9,608 | 5,819 | 2,966 | 8,265 |
| 2016 | 3,964 | 3,234 | 1,707 | 2,767 |
| 2017 | 3,100 | 1,644 | 909 | 550 |
| Total | 271,788 | 207,595 | 163,827 | 243,462 |
Loading, please wait
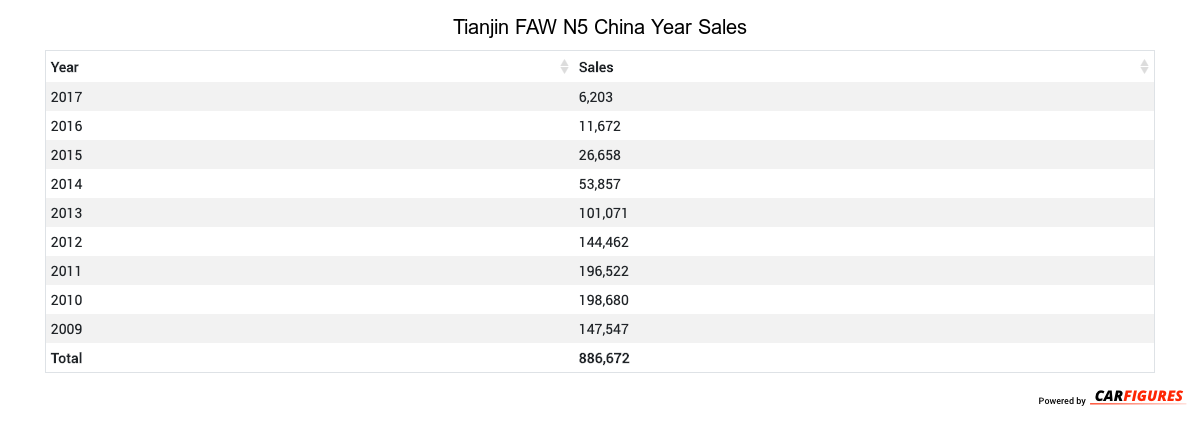
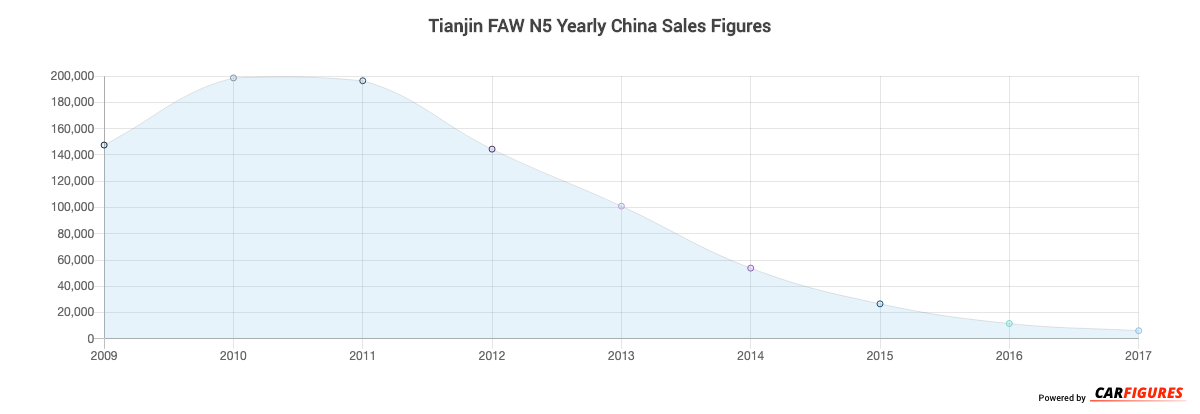
Year | Sales |
|---|---|
| 2017 | 6,203 |
| 2016 | 11,672 |
| 2015 | 26,658 |
| 2014 | 53,857 |
| 2013 | 101,071 |
| 2012 | 144,462 |
| 2011 | 196,522 |
| 2010 | 198,680 |
| 2009 | 147,547 |
| Total | 886,672 |
Download Historic Sales Data
Embedded Code
See more widgetsSources: Manufacturers