Last updated: May 15, 2020
Key Stats
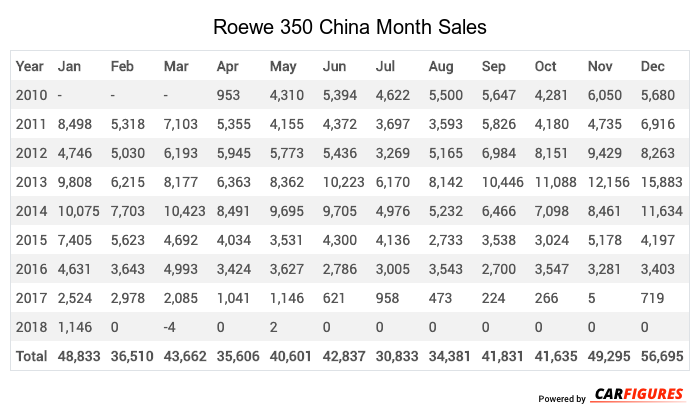
How many 350 did Roewe sell in May 2018?
Roewe sold 2 350 in May 2018.
Overview
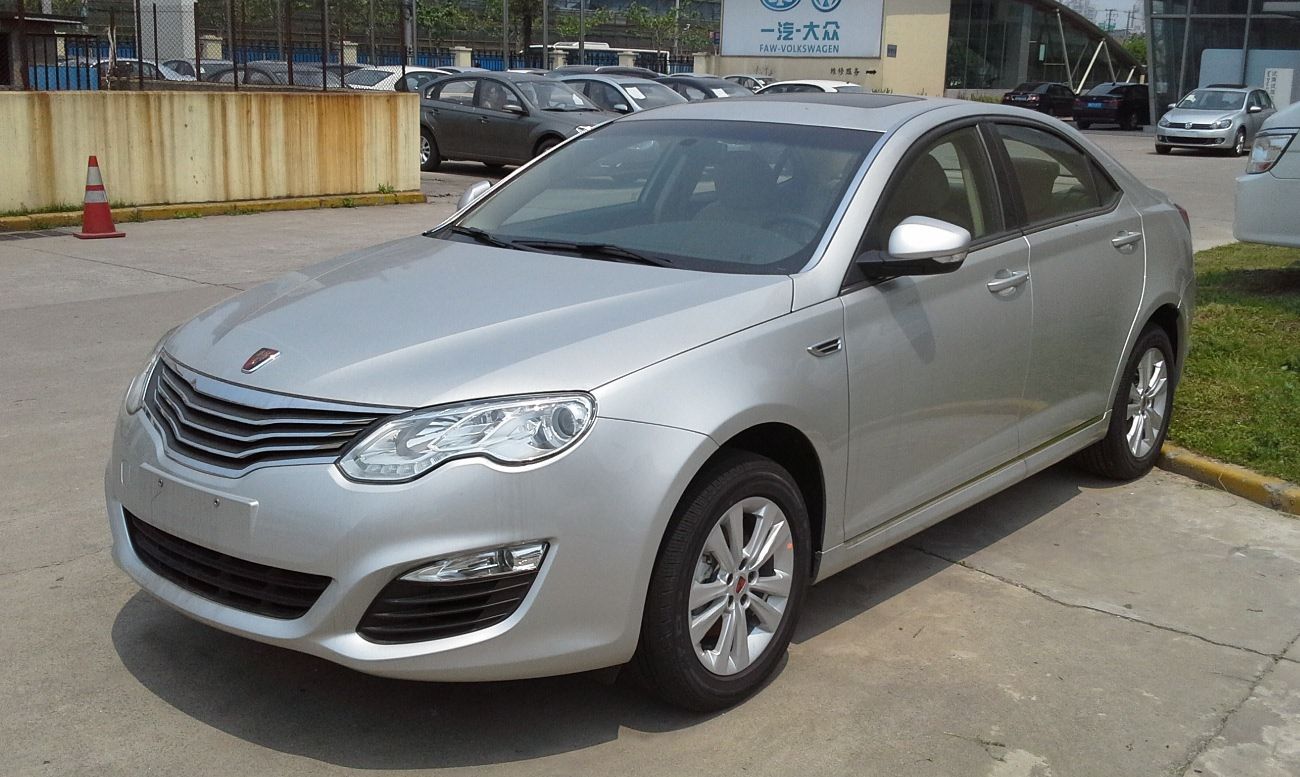
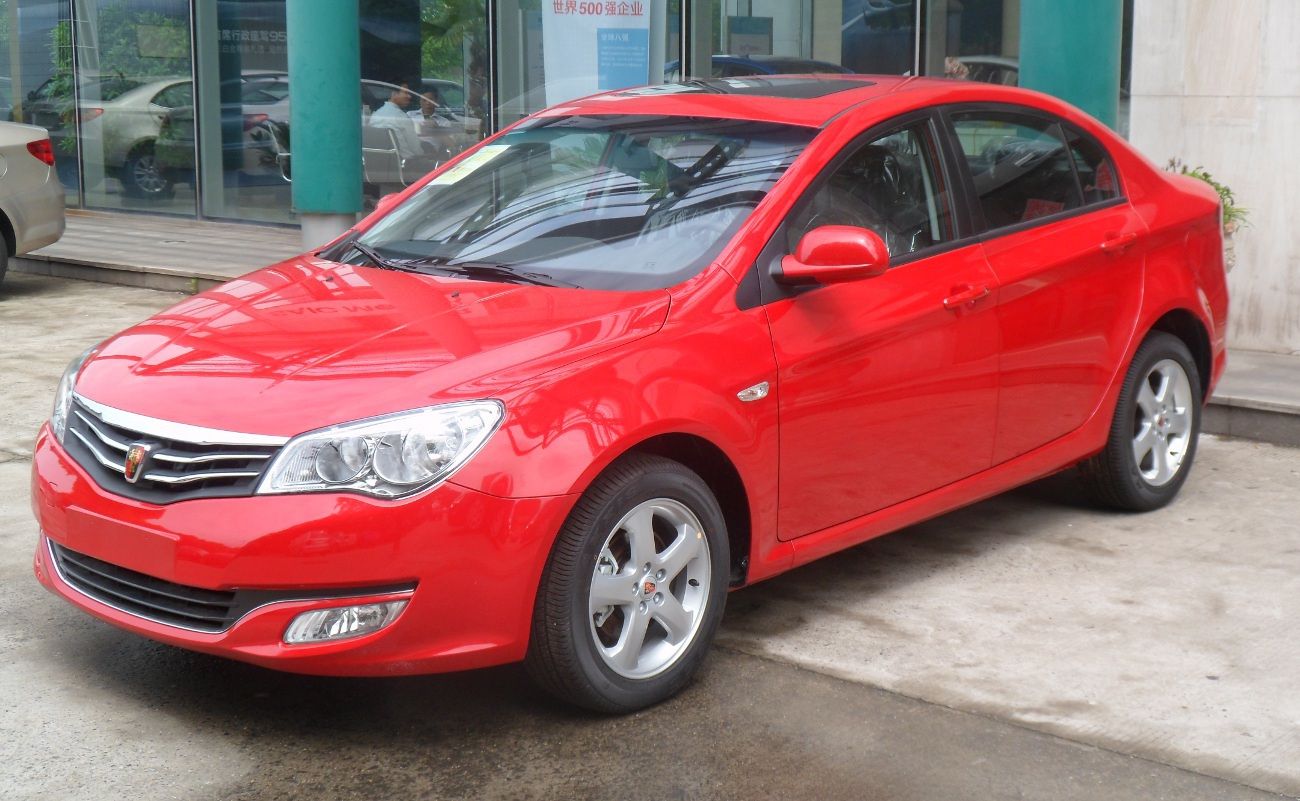
The 350 is a vehicle from automaker Roewe.
How Much Does the Roewe 350 Cost?
Pricing for the 350 starts at CN¥85,700 Yuan ($11,998 USD) MSRP and goes up to CN¥140,700 Yuan ($19,698 USD) fully equipped.
Roewe 350 Engine and Performance
350 is powered by a 1.5LL engine that makes 80 Kw (107.28 HP) - 95 Kw (127.40 HP) and 135 Nm (99.90 ft-lb) - 210 Nm (155.40 ft-lb) torque.
Roewe 350 Specifications
The 350 has a curb weight of 1,300 kg (2,800 lbs) - 1,300 kg (2,800 lbs).
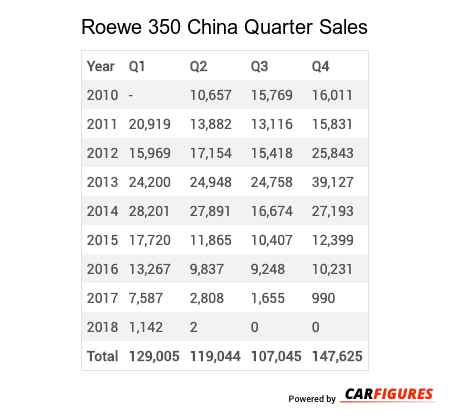
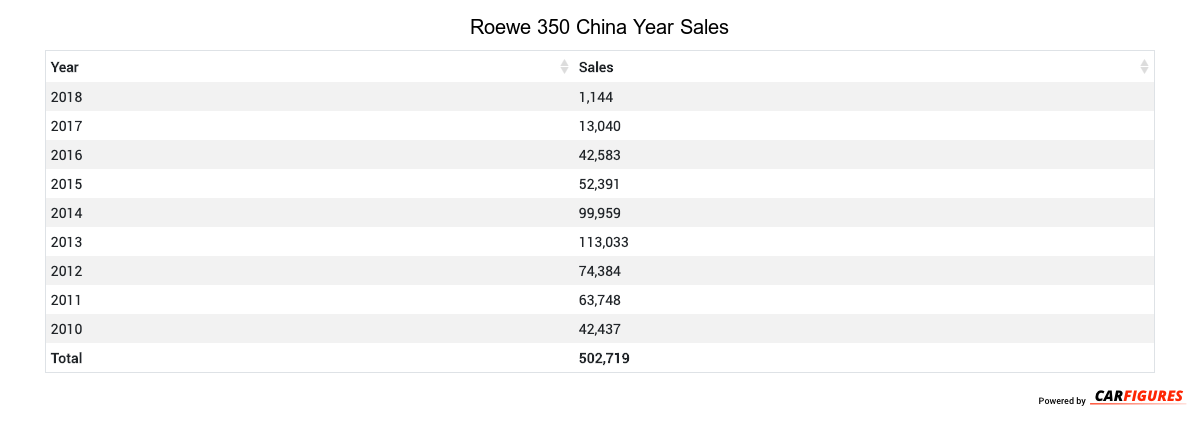
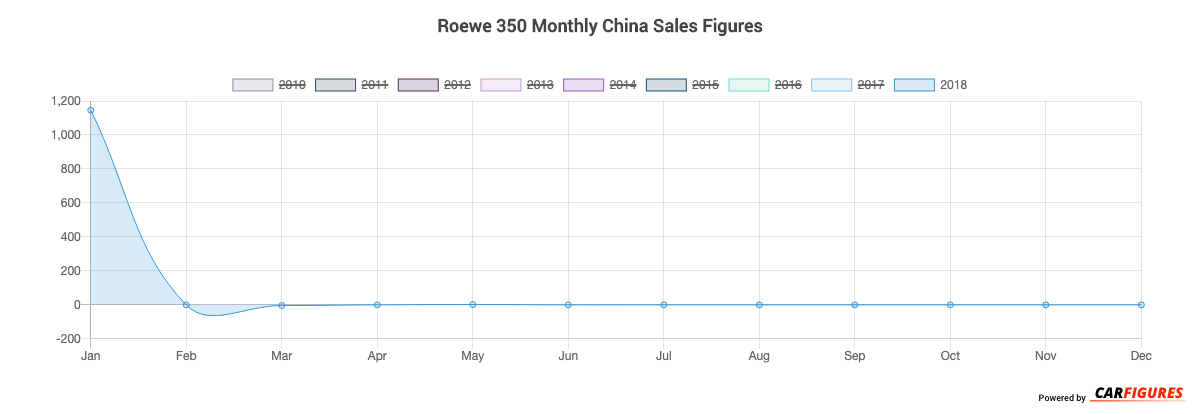
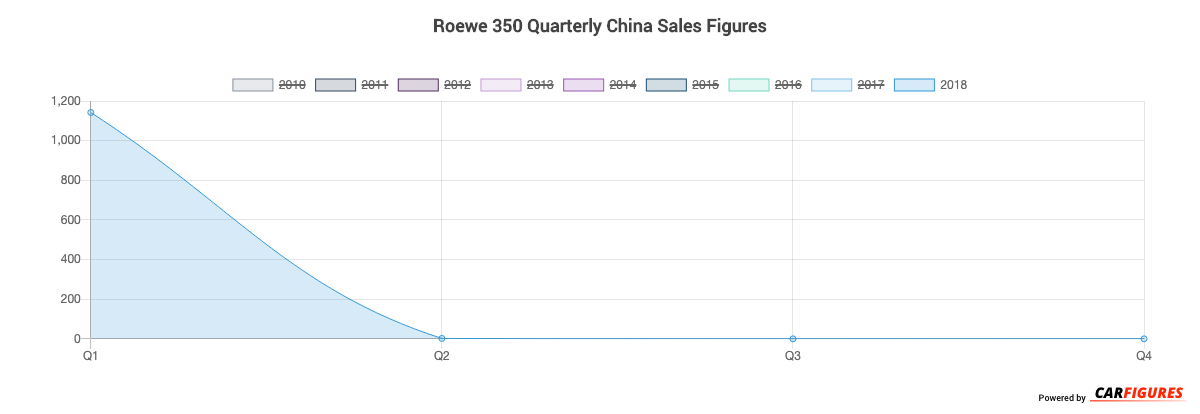
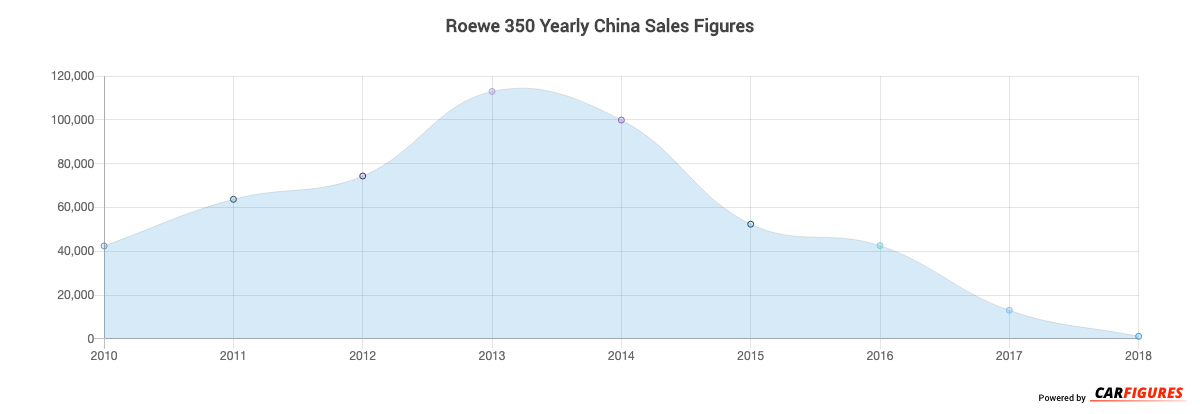
Roewe 350 China Sale figures by year, quarter, and month are presented below. Including the most up to date sales data for the Roewe 350.
Loading, please wait
Year | Jan | Feb | Mar | Apr | May | Jun | Jul | Aug | Sep | Oct | Nov | Dec |
|---|---|---|---|---|---|---|---|---|---|---|---|---|
| 2010 | - | - | - | 953 | 4,310 | 5,394 | 4,622 | 5,500 | 5,647 | 4,281 | 6,050 | 5,680 |
| 2011 | 8,498 | 5,318 | 7,103 | 5,355 | 4,155 | 4,372 | 3,697 | 3,593 | 5,826 | 4,180 | 4,735 | 6,916 |
| 2012 | 4,746 | 5,030 | 6,193 | 5,945 | 5,773 | 5,436 | 3,269 | 5,165 | 6,984 | 8,151 | 9,429 | 8,263 |
| 2013 | 9,808 | 6,215 | 8,177 | 6,363 | 8,362 | 10,223 | 6,170 | 8,142 | 10,446 | 11,088 | 12,156 | 15,883 |
| 2014 | 10,075 | 7,703 | 10,423 | 8,491 | 9,695 | 9,705 | 4,976 | 5,232 | 6,466 | 7,098 | 8,461 | 11,634 |
| 2015 | 7,405 | 5,623 | 4,692 | 4,034 | 3,531 | 4,300 | 4,136 | 2,733 | 3,538 | 3,024 | 5,178 | 4,197 |
| 2016 | 4,631 | 3,643 | 4,993 | 3,424 | 3,627 | 2,786 | 3,005 | 3,543 | 2,700 | 3,547 | 3,281 | 3,403 |
| 2017 | 2,524 | 2,978 | 2,085 | 1,041 | 1,146 | 621 | 958 | 473 | 224 | 266 | 5 | 719 |
| 2018 | 1,146 | 0 | -4 | 0 | 2 | 0 | 0 | 0 | 0 | 0 | 0 | 0 |
| Total | 48,833 | 36,510 | 43,662 | 35,606 | 40,601 | 42,837 | 30,833 | 34,381 | 41,831 | 41,635 | 49,295 | 56,695 |
Loading, please wait
Year | Q1 | Q2 | Q3 | Q4 |
|---|---|---|---|---|
| 2010 | - | 10,657 | 15,769 | 16,011 |
| 2011 | 20,919 | 13,882 | 13,116 | 15,831 |
| 2012 | 15,969 | 17,154 | 15,418 | 25,843 |
| 2013 | 24,200 | 24,948 | 24,758 | 39,127 |
| 2014 | 28,201 | 27,891 | 16,674 | 27,193 |
| 2015 | 17,720 | 11,865 | 10,407 | 12,399 |
| 2016 | 13,267 | 9,837 | 9,248 | 10,231 |
| 2017 | 7,587 | 2,808 | 1,655 | 990 |
| 2018 | 1,142 | 2 | 0 | 0 |
| Total | 129,005 | 119,044 | 107,045 | 147,625 |
Loading, please wait
Year | Sales |
|---|---|
| 2018 | 1,144 |
| 2017 | 13,040 |
| 2016 | 42,583 |
| 2015 | 52,391 |
| 2014 | 99,959 |
| 2013 | 113,033 |
| 2012 | 74,384 |
| 2011 | 63,748 |
| 2010 | 42,437 |
| Total | 502,719 |
Download Historic Sales Data
Embedded Code
See more widgetsSources: Manufacturers