Key Stats
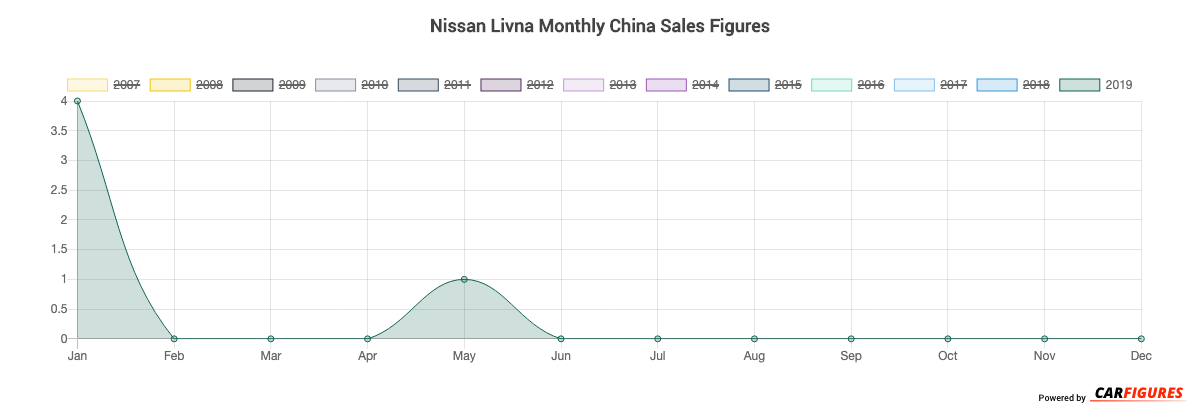
How many Livna did Nissan sell in May 2019?
Nissan sold 1 Livna in May 2019.
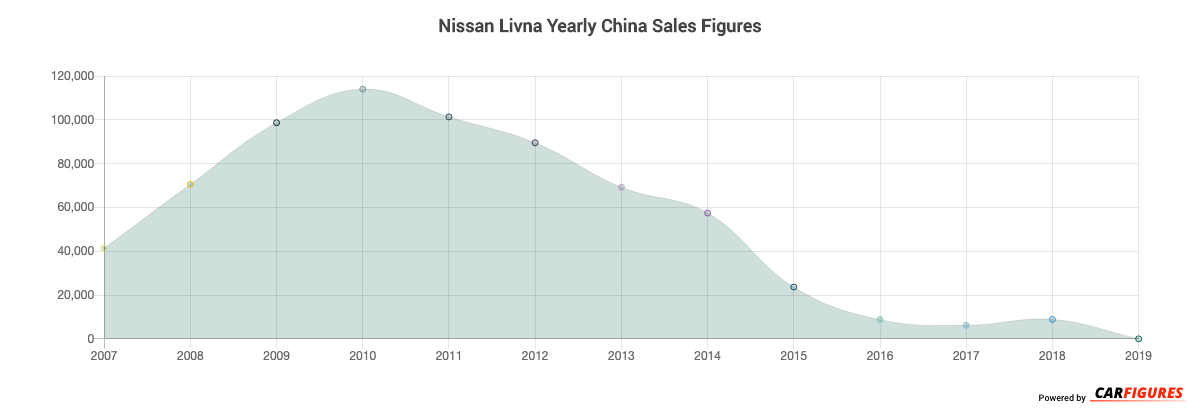
How many Livna did Nissan sell in 2019?
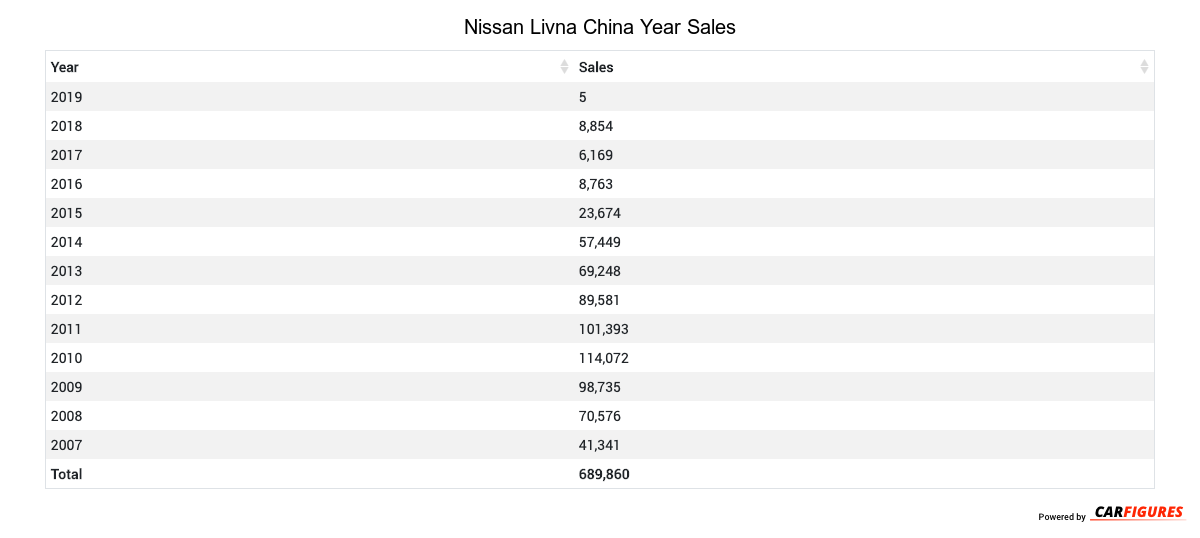
Nissan sold 5 Livna in 2019. In 2018, Nissan sold 8,854 Livna. They sold 8,849 more units in year 2018 compared to 2019 with a percent loss of 99.94% YoY.
Overview
The Livna is a vehicle from automaker Nissan.
How Much Does the Nissan Livna Cost?
The Livna starts at CN¥85,800 Yuan ($12,012 USD) MSRP. Fully equipped, the Livna will cost you about CN¥117,200 Yuan ($16,408 USD).
Nissan Livna Engine and Performance
Livna is powered by a 1.6L engine that makes 91 Kw (122.03 HP) - 91 Kw (122.03 HP) and 153 Nm (113.22 ft-lb) - 153 Nm (113.22 ft-lb) torque.
Nissan Livna Specifications
The Livna has a curb weight of 1,100 kg (2,500 lbs) - 1,200 kg (2,700 lbs).
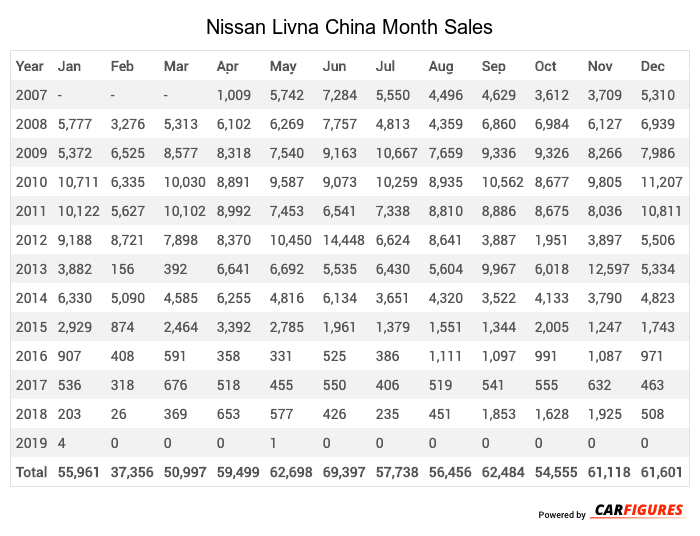
Nissan Livna China Sale figures by year, quarter, and month are presented below. Including the most up to date sales data for the Nissan Livna.
Year | Jan | Feb | Mar | Apr | May | Jun | Jul | Aug | Sep | Oct | Nov | Dec |
|---|---|---|---|---|---|---|---|---|---|---|---|---|
| 2007 | - | - | - | 1,009 | 5,742 | 7,284 | 5,550 | 4,496 | 4,629 | 3,612 | 3,709 | 5,310 |
| 2008 | 5,777 | 3,276 | 5,313 | 6,102 | 6,269 | 7,757 | 4,813 | 4,359 | 6,860 | 6,984 | 6,127 | 6,939 |
| 2009 | 5,372 | 6,525 | 8,577 | 8,318 | 7,540 | 9,163 | 10,667 | 7,659 | 9,336 | 9,326 | 8,266 | 7,986 |
| 2010 | 10,711 | 6,335 | 10,030 | 8,891 | 9,587 | 9,073 | 10,259 | 8,935 | 10,562 | 8,677 | 9,805 | 11,207 |
| 2011 | 10,122 | 5,627 | 10,102 | 8,992 | 7,453 | 6,541 | 7,338 | 8,810 | 8,886 | 8,675 | 8,036 | 10,811 |
| 2012 | 9,188 | 8,721 | 7,898 | 8,370 | 10,450 | 14,448 | 6,624 | 8,641 | 3,887 | 1,951 | 3,897 | 5,506 |
| 2013 | 3,882 | 156 | 392 | 6,641 | 6,692 | 5,535 | 6,430 | 5,604 | 9,967 | 6,018 | 12,597 | 5,334 |
| 2014 | 6,330 | 5,090 | 4,585 | 6,255 | 4,816 | 6,134 | 3,651 | 4,320 | 3,522 | 4,133 | 3,790 | 4,823 |
| 2015 | 2,929 | 874 | 2,464 | 3,392 | 2,785 | 1,961 | 1,379 | 1,551 | 1,344 | 2,005 | 1,247 | 1,743 |
| 2016 | 907 | 408 | 591 | 358 | 331 | 525 | 386 | 1,111 | 1,097 | 991 | 1,087 | 971 |
| 2017 | 536 | 318 | 676 | 518 | 455 | 550 | 406 | 519 | 541 | 555 | 632 | 463 |
| 2018 | 203 | 26 | 369 | 653 | 577 | 426 | 235 | 451 | 1,853 | 1,628 | 1,925 | 508 |
| 2019 | 4 | 0 | 0 | 0 | 1 | 0 | 0 | 0 | 0 | 0 | 0 | 0 |
| Total | 55,961 | 37,356 | 50,997 | 59,499 | 62,698 | 69,397 | 57,738 | 56,456 | 62,484 | 54,555 | 61,118 | 61,601 |
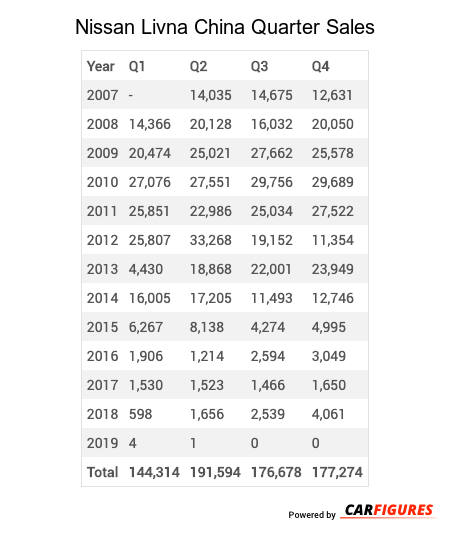
Year | Q1 | Q2 | Q3 | Q4 |
|---|---|---|---|---|
| 2007 | - | 14,035 | 14,675 | 12,631 |
| 2008 | 14,366 | 20,128 | 16,032 | 20,050 |
| 2009 | 20,474 | 25,021 | 27,662 | 25,578 |
| 2010 | 27,076 | 27,551 | 29,756 | 29,689 |
| 2011 | 25,851 | 22,986 | 25,034 | 27,522 |
| 2012 | 25,807 | 33,268 | 19,152 | 11,354 |
| 2013 | 4,430 | 18,868 | 22,001 | 23,949 |
| 2014 | 16,005 | 17,205 | 11,493 | 12,746 |
| 2015 | 6,267 | 8,138 | 4,274 | 4,995 |
| 2016 | 1,906 | 1,214 | 2,594 | 3,049 |
| 2017 | 1,530 | 1,523 | 1,466 | 1,650 |
| 2018 | 598 | 1,656 | 2,539 | 4,061 |
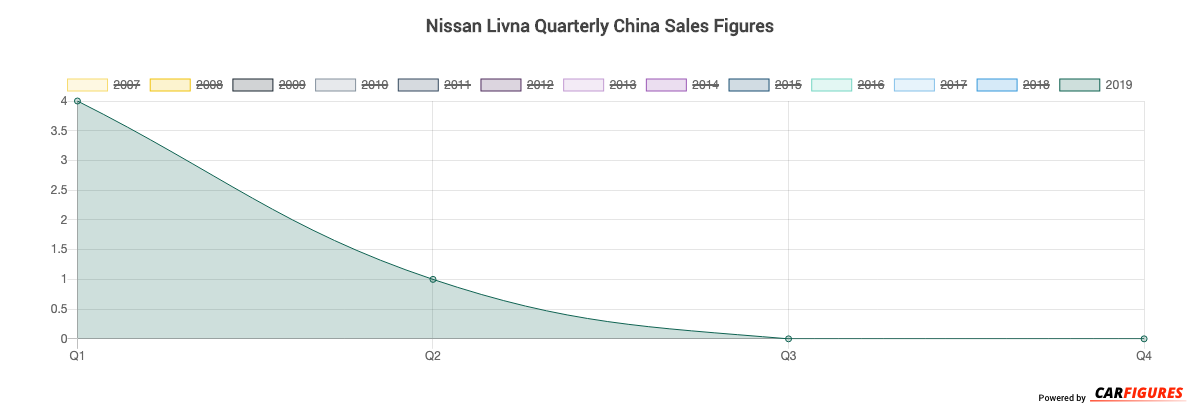
| 2019 | 4 | 1 | 0 | 0 |
| Total | 144,314 | 191,594 | 176,678 | 177,274 |
Year | Sales |
|---|---|
| 2019 | 5 |
| 2018 | 8,854 |
| 2017 | 6,169 |
| 2016 | 8,763 |
| 2015 | 23,674 |
| 2014 | 57,449 |
| 2013 | 69,248 |
| 2012 | 89,581 |
| 2011 | 101,393 |
| 2010 | 114,072 |
| 2009 | 98,735 |
| 2008 | 70,576 |
| 2007 | 41,341 |
| Total | 689,860 |
Download Historic Sales Data
Embedded Code
See more widgetsSources: Manufacturers