Last updated: May 15, 2020
Key Stats
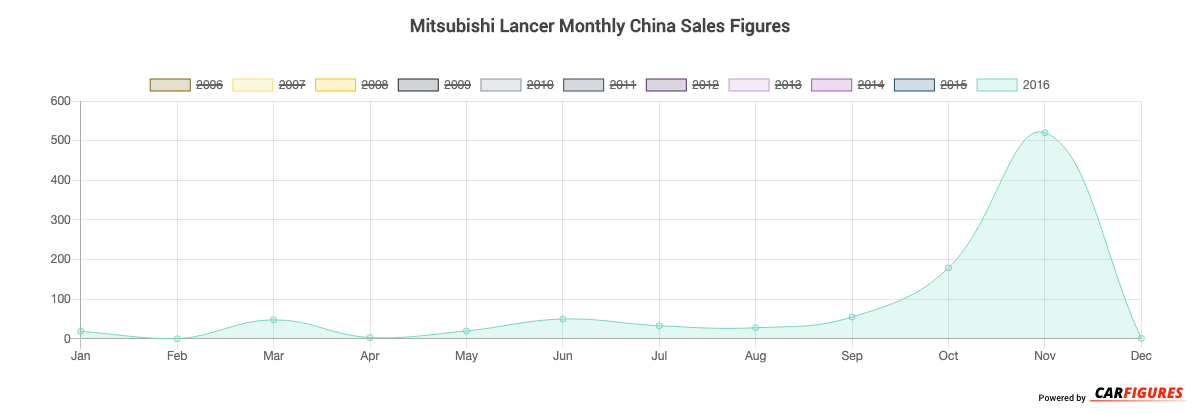
How many Lancer did Mitsubishi sell in December 2016?
Mitsubishi sold 1 Lancer in December 2016.
Overview
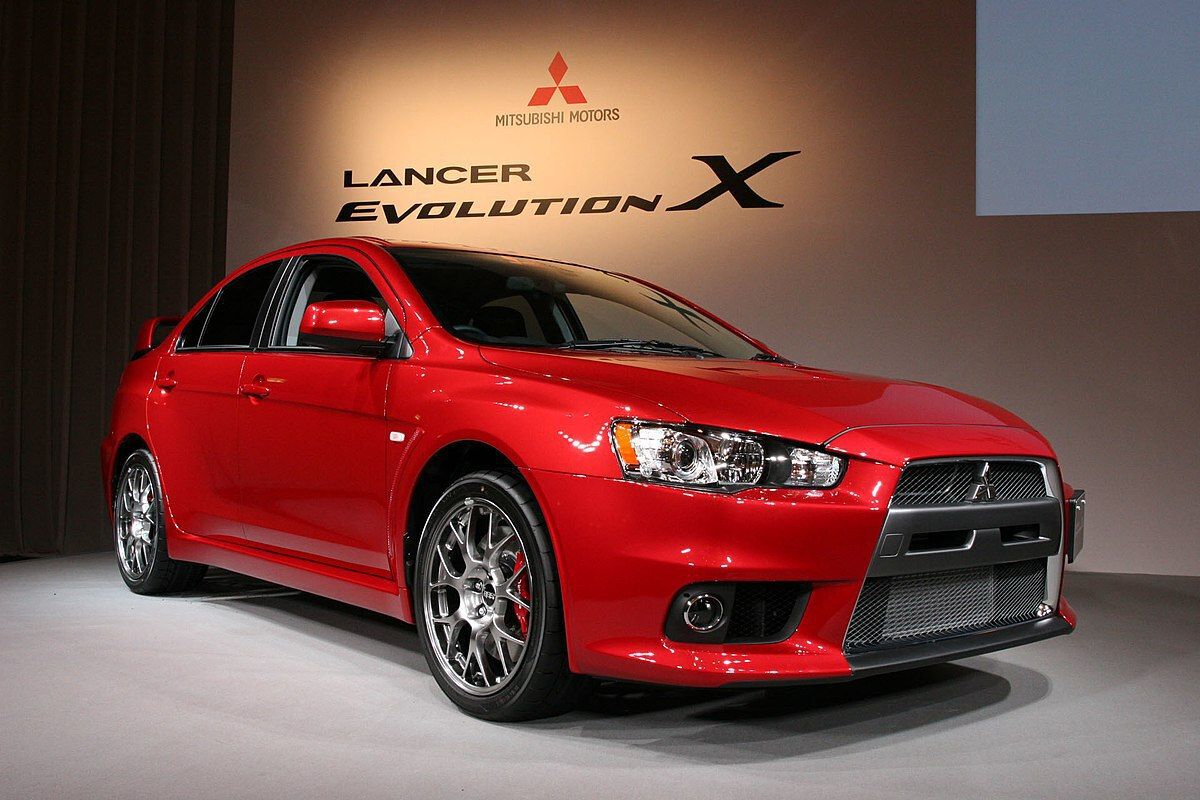
The Lancer is a vehicle from automaker Mitsubishi.
How Much Does the Mitsubishi Lancer Cost?
The Lancer starts at CN¥76,800 Yuan ($10,752 USD) MSRP. Fully equipped, the Lancer will cost you about CN¥76,800 Yuan ($10,752 USD).
Mitsubishi Lancer Engine and Performance
Lancer includes a 1.6L engine. This delivers 73 Kw (97.89 HP) - 73 Kw (97.89 HP) and 136 Nm (100.64 ft-lb) - 136 Nm (100.64 ft-lb) torque.
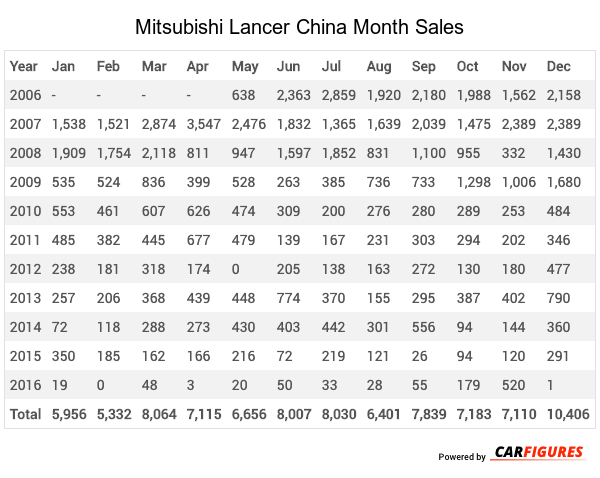
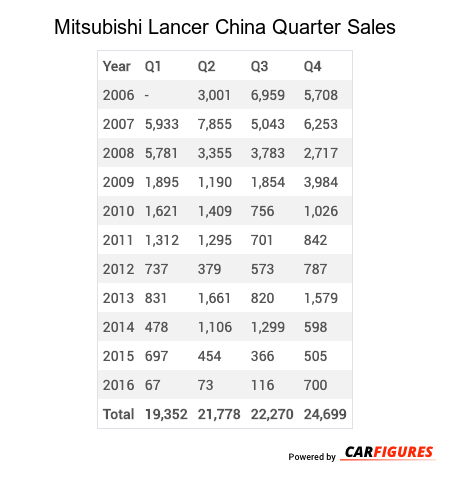
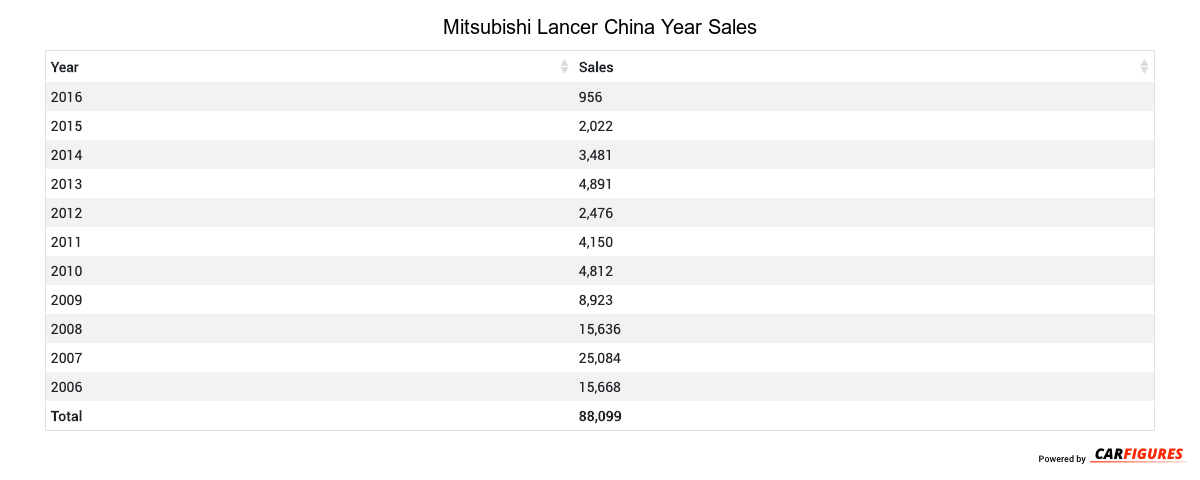
Mitsubishi Lancer China Sale figures by year, quarter, and month are presented below. Including the most up to date sales data for the Mitsubishi Lancer.
Loading, please wait
Year | Jan | Feb | Mar | Apr | May | Jun | Jul | Aug | Sep | Oct | Nov | Dec |
|---|---|---|---|---|---|---|---|---|---|---|---|---|
| 2006 | - | - | - | - | 638 | 2,363 | 2,859 | 1,920 | 2,180 | 1,988 | 1,562 | 2,158 |
| 2007 | 1,538 | 1,521 | 2,874 | 3,547 | 2,476 | 1,832 | 1,365 | 1,639 | 2,039 | 1,475 | 2,389 | 2,389 |
| 2008 | 1,909 | 1,754 | 2,118 | 811 | 947 | 1,597 | 1,852 | 831 | 1,100 | 955 | 332 | 1,430 |
| 2009 | 535 | 524 | 836 | 399 | 528 | 263 | 385 | 736 | 733 | 1,298 | 1,006 | 1,680 |
| 2010 | 553 | 461 | 607 | 626 | 474 | 309 | 200 | 276 | 280 | 289 | 253 | 484 |
| 2011 | 485 | 382 | 445 | 677 | 479 | 139 | 167 | 231 | 303 | 294 | 202 | 346 |
| 2012 | 238 | 181 | 318 | 174 | 0 | 205 | 138 | 163 | 272 | 130 | 180 | 477 |
| 2013 | 257 | 206 | 368 | 439 | 448 | 774 | 370 | 155 | 295 | 387 | 402 | 790 |
| 2014 | 72 | 118 | 288 | 273 | 430 | 403 | 442 | 301 | 556 | 94 | 144 | 360 |
| 2015 | 350 | 185 | 162 | 166 | 216 | 72 | 219 | 121 | 26 | 94 | 120 | 291 |
| 2016 | 19 | 0 | 48 | 3 | 20 | 50 | 33 | 28 | 55 | 179 | 520 | 1 |
| Total | 5,956 | 5,332 | 8,064 | 7,115 | 6,656 | 8,007 | 8,030 | 6,401 | 7,839 | 7,183 | 7,110 | 10,406 |
Loading, please wait
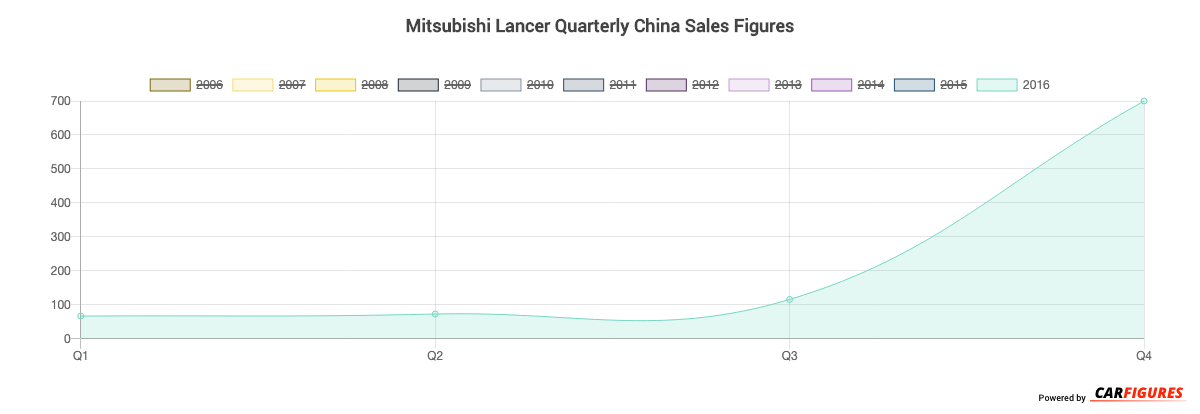
Year | Q1 | Q2 | Q3 | Q4 |
|---|---|---|---|---|
| 2006 | - | 3,001 | 6,959 | 5,708 |
| 2007 | 5,933 | 7,855 | 5,043 | 6,253 |
| 2008 | 5,781 | 3,355 | 3,783 | 2,717 |
| 2009 | 1,895 | 1,190 | 1,854 | 3,984 |
| 2010 | 1,621 | 1,409 | 756 | 1,026 |
| 2011 | 1,312 | 1,295 | 701 | 842 |
| 2012 | 737 | 379 | 573 | 787 |
| 2013 | 831 | 1,661 | 820 | 1,579 |
| 2014 | 478 | 1,106 | 1,299 | 598 |
| 2015 | 697 | 454 | 366 | 505 |
| 2016 | 67 | 73 | 116 | 700 |
| Total | 19,352 | 21,778 | 22,270 | 24,699 |
Loading, please wait
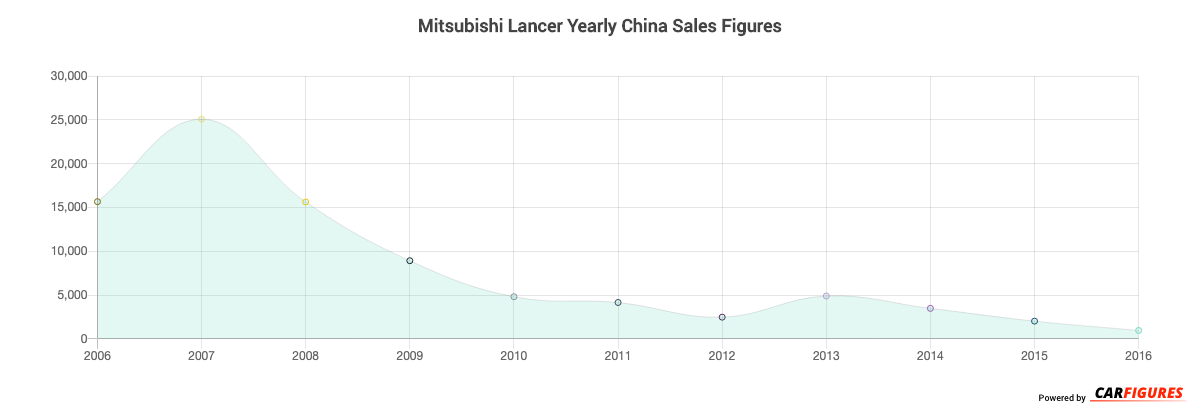
Year | Sales |
|---|---|
| 2016 | 956 |
| 2015 | 2,022 |
| 2014 | 3,481 |
| 2013 | 4,891 |
| 2012 | 2,476 |
| 2011 | 4,150 |
| 2010 | 4,812 |
| 2009 | 8,923 |
| 2008 | 15,636 |
| 2007 | 25,084 |
| 2006 | 15,668 |
| Total | 88,099 |
Download Historic Sales Data
Embedded Code
See more widgetsSources: Manufacturers