Last updated: May 15, 2020
Key Stats
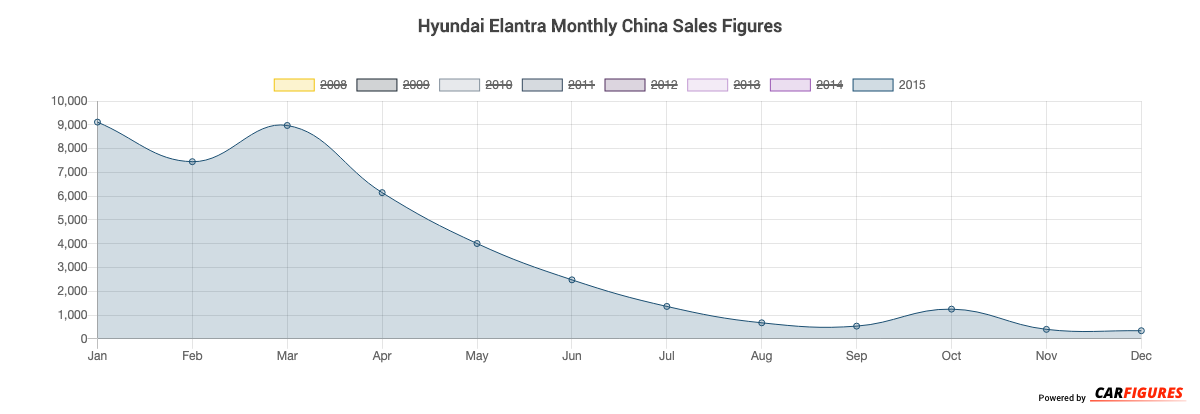
How many Elantra did Hyundai sell in December 2015?
Hyundai sold 341 Elantra in December 2015.
Overview
The Elantra is a 4-door 5-seater sedan with room for 5 people.
How Much Does the Hyundai Elantra Cost?
The Elantra starts at CN¥79,900 Yuan ($11,186 USD) MSRP. Fully equipped, the Elantra will cost you about CN¥115,900 Yuan ($16,226 USD).
Hyundai Elantra Engine and Performance
Elantra includes a 1.6LL engine. This delivers 90. 2 Kw (120. 96 HP) - 90. 2 Kw (120. 96 HP) and 150. 7 Nm (111. 52 ft-lb) - 150. 7 Nm (111. 52 ft-lb) torque.
Hyundai Elantra Specifications
The Elantra has a curb weight of 1,100 kg (2,500 lbs) - 1,200 kg (2,600 lbs).
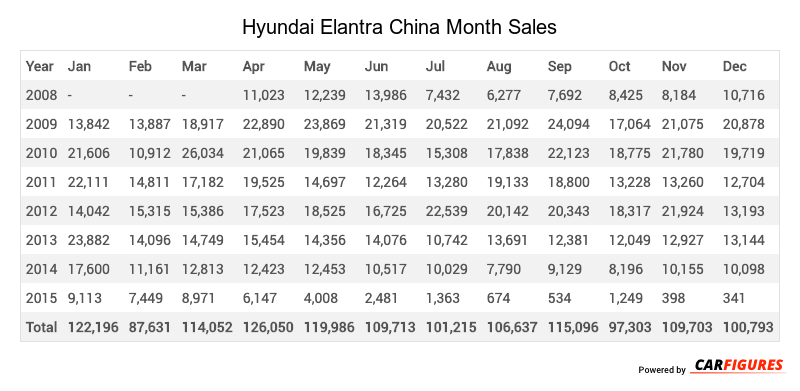
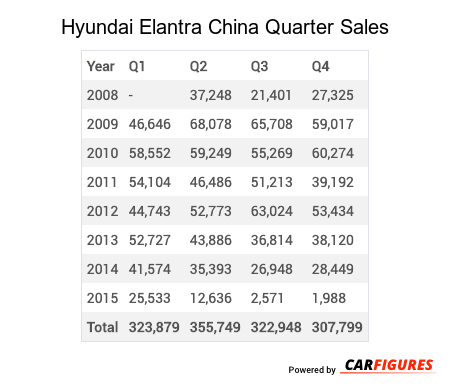
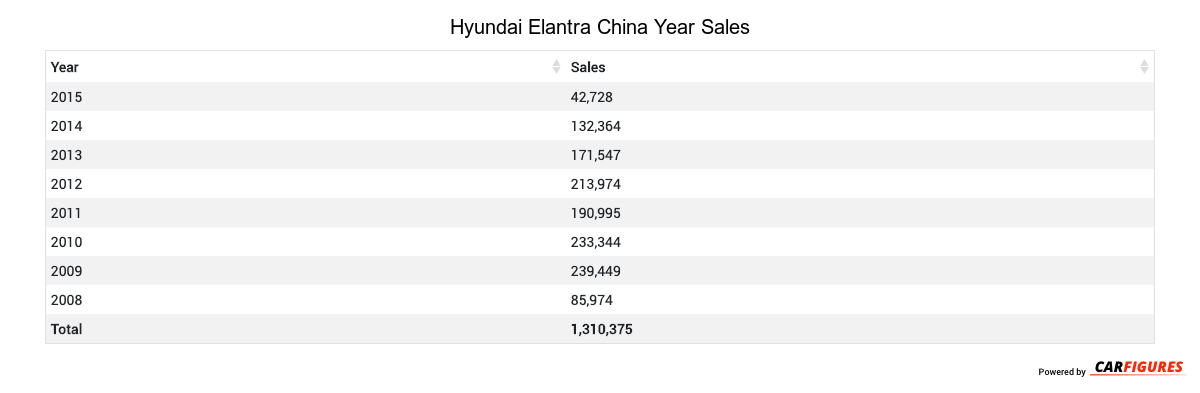
Hyundai Elantra China Sale figures by year, quarter, and month are presented below. Including the most up to date sales data for the Hyundai Elantra.
Loading, please wait
Year | Jan | Feb | Mar | Apr | May | Jun | Jul | Aug | Sep | Oct | Nov | Dec |
|---|---|---|---|---|---|---|---|---|---|---|---|---|
| 2008 | - | - | - | 11,023 | 12,239 | 13,986 | 7,432 | 6,277 | 7,692 | 8,425 | 8,184 | 10,716 |
| 2009 | 13,842 | 13,887 | 18,917 | 22,890 | 23,869 | 21,319 | 20,522 | 21,092 | 24,094 | 17,064 | 21,075 | 20,878 |
| 2010 | 21,606 | 10,912 | 26,034 | 21,065 | 19,839 | 18,345 | 15,308 | 17,838 | 22,123 | 18,775 | 21,780 | 19,719 |
| 2011 | 22,111 | 14,811 | 17,182 | 19,525 | 14,697 | 12,264 | 13,280 | 19,133 | 18,800 | 13,228 | 13,260 | 12,704 |
| 2012 | 14,042 | 15,315 | 15,386 | 17,523 | 18,525 | 16,725 | 22,539 | 20,142 | 20,343 | 18,317 | 21,924 | 13,193 |
| 2013 | 23,882 | 14,096 | 14,749 | 15,454 | 14,356 | 14,076 | 10,742 | 13,691 | 12,381 | 12,049 | 12,927 | 13,144 |
| 2014 | 17,600 | 11,161 | 12,813 | 12,423 | 12,453 | 10,517 | 10,029 | 7,790 | 9,129 | 8,196 | 10,155 | 10,098 |
| 2015 | 9,113 | 7,449 | 8,971 | 6,147 | 4,008 | 2,481 | 1,363 | 674 | 534 | 1,249 | 398 | 341 |
| Total | 122,196 | 87,631 | 114,052 | 126,050 | 119,986 | 109,713 | 101,215 | 106,637 | 115,096 | 97,303 | 109,703 | 100,793 |
Loading, please wait
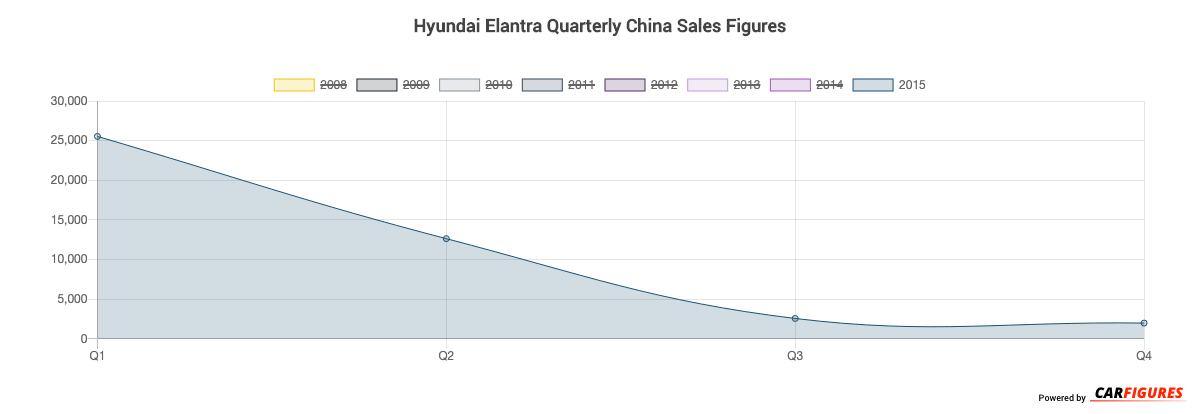
Year | Q1 | Q2 | Q3 | Q4 |
|---|---|---|---|---|
| 2008 | - | 37,248 | 21,401 | 27,325 |
| 2009 | 46,646 | 68,078 | 65,708 | 59,017 |
| 2010 | 58,552 | 59,249 | 55,269 | 60,274 |
| 2011 | 54,104 | 46,486 | 51,213 | 39,192 |
| 2012 | 44,743 | 52,773 | 63,024 | 53,434 |
| 2013 | 52,727 | 43,886 | 36,814 | 38,120 |
| 2014 | 41,574 | 35,393 | 26,948 | 28,449 |
| 2015 | 25,533 | 12,636 | 2,571 | 1,988 |
| Total | 323,879 | 355,749 | 322,948 | 307,799 |
Loading, please wait
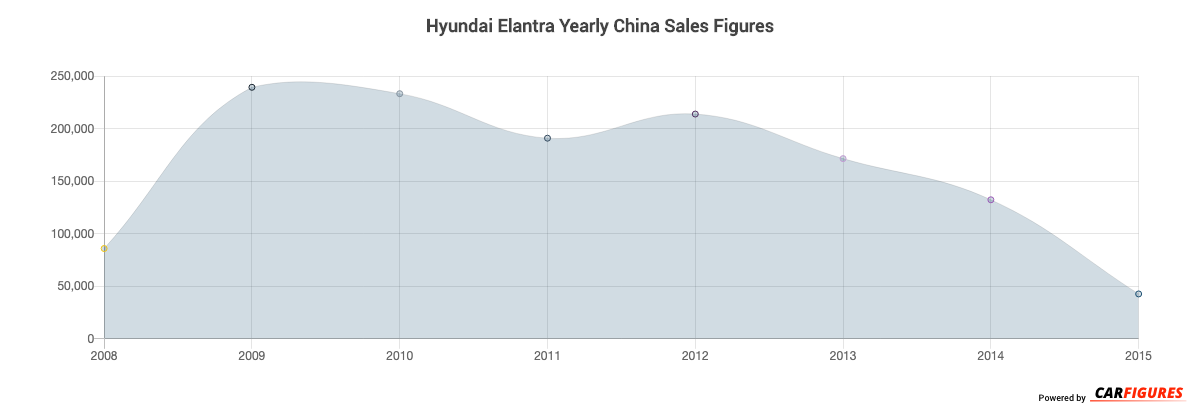
Year | Sales |
|---|---|
| 2015 | 42,728 |
| 2014 | 132,364 |
| 2013 | 171,547 |
| 2012 | 213,974 |
| 2011 | 190,995 |
| 2010 | 233,344 |
| 2009 | 239,449 |
| 2008 | 85,974 |
| Total | 1,310,375 |
Download Historic Sales Data
Embedded Code
See more widgetsSources: Manufacturers