Last updated: September 01, 2020

Key Stats
How many MP-X did Foton Motor sell in 2020?
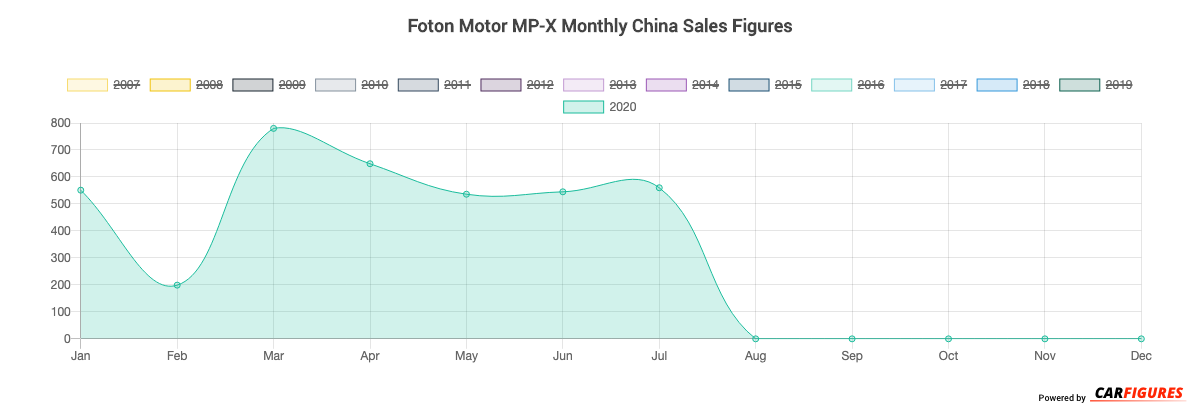
Foton Motor sold 3,820 MP-X in 2020. (From Jan - Dec 2020)
How many MP-X did Foton Motor sell in July 2020?
Foton Motor sold 560 MP-X in July 2020.
How many MP-X did Foton Motor sell in 2019?
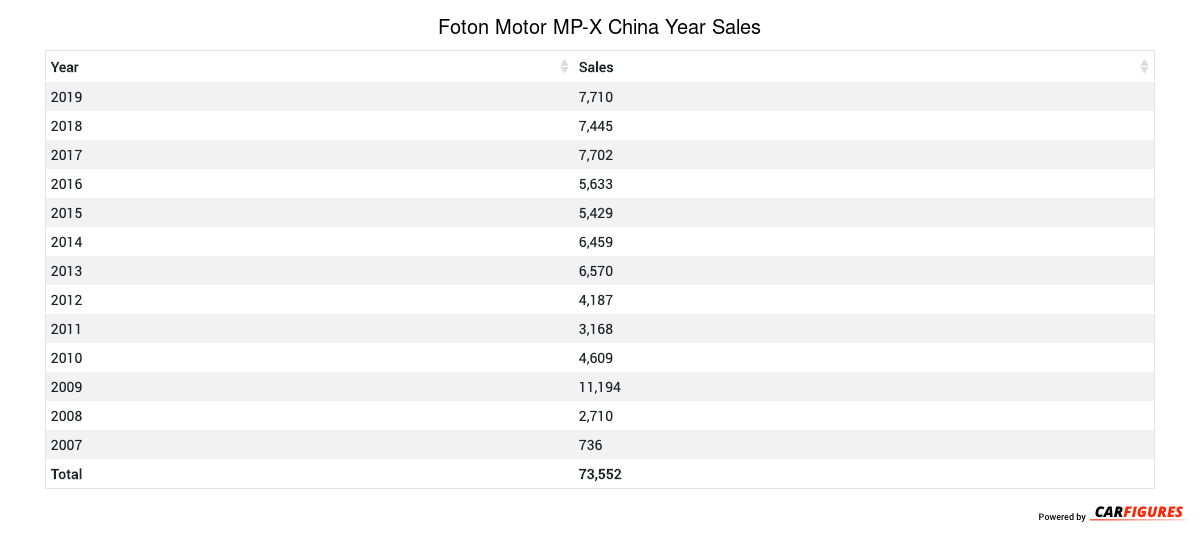
Foton Motor sold 7,710 MP-X in 2019. In 2018, Foton Motor sold 7,445 MP-X. They sold 265 more units in 2019 compared to 2018 with a percent gain of 3.56% YoY.
Overview
The MP-X is a vehicle from automaker Foton Motor.
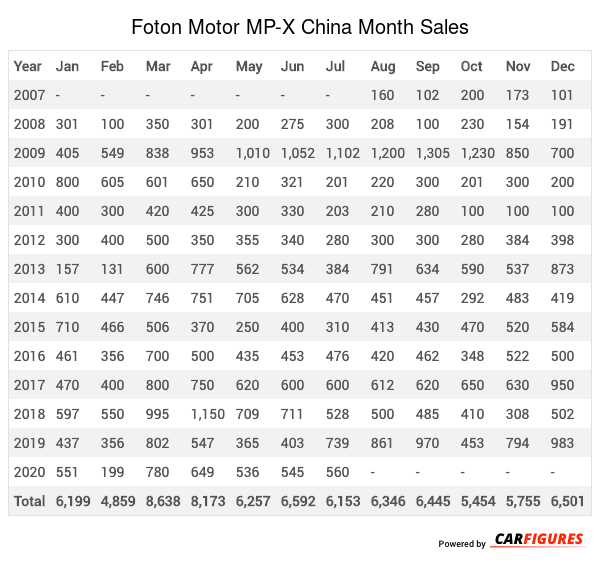
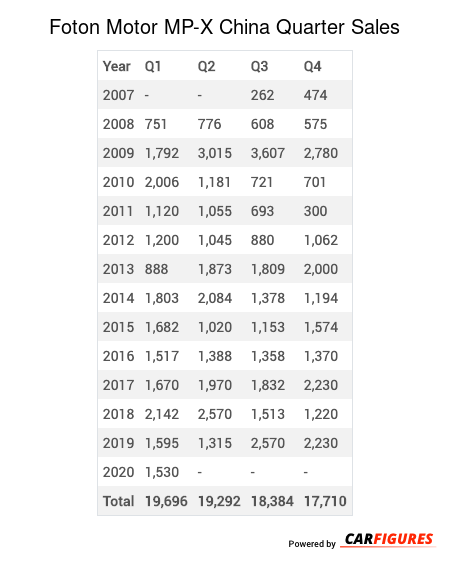
Foton Motor MP-X China Sale figures by year, quarter, and month are presented below. Including the most up to date sales data for the Foton Motor MP-X.
Loading, please wait
Year | Jan | Feb | Mar | Apr | May | Jun | Jul | Aug | Sep | Oct | Nov | Dec |
|---|---|---|---|---|---|---|---|---|---|---|---|---|
| 2007 | - | - | - | - | - | - | - | 160 | 102 | 200 | 173 | 101 |
| 2008 | 301 | 100 | 350 | 301 | 200 | 275 | 300 | 208 | 100 | 230 | 154 | 191 |
| 2009 | 405 | 549 | 838 | 953 | 1,010 | 1,052 | 1,102 | 1,200 | 1,305 | 1,230 | 850 | 700 |
| 2010 | 800 | 605 | 601 | 650 | 210 | 321 | 201 | 220 | 300 | 201 | 300 | 200 |
| 2011 | 400 | 300 | 420 | 425 | 300 | 330 | 203 | 210 | 280 | 100 | 100 | 100 |
| 2012 | 300 | 400 | 500 | 350 | 355 | 340 | 280 | 300 | 300 | 280 | 384 | 398 |
| 2013 | 157 | 131 | 600 | 777 | 562 | 534 | 384 | 791 | 634 | 590 | 537 | 873 |
| 2014 | 610 | 447 | 746 | 751 | 705 | 628 | 470 | 451 | 457 | 292 | 483 | 419 |
| 2015 | 710 | 466 | 506 | 370 | 250 | 400 | 310 | 413 | 430 | 470 | 520 | 584 |
| 2016 | 461 | 356 | 700 | 500 | 435 | 453 | 476 | 420 | 462 | 348 | 522 | 500 |
| 2017 | 470 | 400 | 800 | 750 | 620 | 600 | 600 | 612 | 620 | 650 | 630 | 950 |
| 2018 | 597 | 550 | 995 | 1,150 | 709 | 711 | 528 | 500 | 485 | 410 | 308 | 502 |
| 2019 | 437 | 356 | 802 | 547 | 365 | 403 | 739 | 861 | 970 | 453 | 794 | 983 |
| 2020 | 551 | 199 | 780 | 649 | 536 | 545 | 560 | - | - | - | - | - |
| Total | 6,199 | 4,859 | 8,638 | 8,173 | 6,257 | 6,592 | 6,153 | 6,346 | 6,445 | 5,454 | 5,755 | 6,501 |
Loading, please wait
Year | Q1 | Q2 | Q3 | Q4 |
|---|---|---|---|---|
| 2007 | - | - | 262 | 474 |
| 2008 | 751 | 776 | 608 | 575 |
| 2009 | 1,792 | 3,015 | 3,607 | 2,780 |
| 2010 | 2,006 | 1,181 | 721 | 701 |
| 2011 | 1,120 | 1,055 | 693 | 300 |
| 2012 | 1,200 | 1,045 | 880 | 1,062 |
| 2013 | 888 | 1,873 | 1,809 | 2,000 |
| 2014 | 1,803 | 2,084 | 1,378 | 1,194 |
| 2015 | 1,682 | 1,020 | 1,153 | 1,574 |
| 2016 | 1,517 | 1,388 | 1,358 | 1,370 |
| 2017 | 1,670 | 1,970 | 1,832 | 2,230 |
| 2018 | 2,142 | 2,570 | 1,513 | 1,220 |
| 2019 | 1,595 | 1,315 | 2,570 | 2,230 |
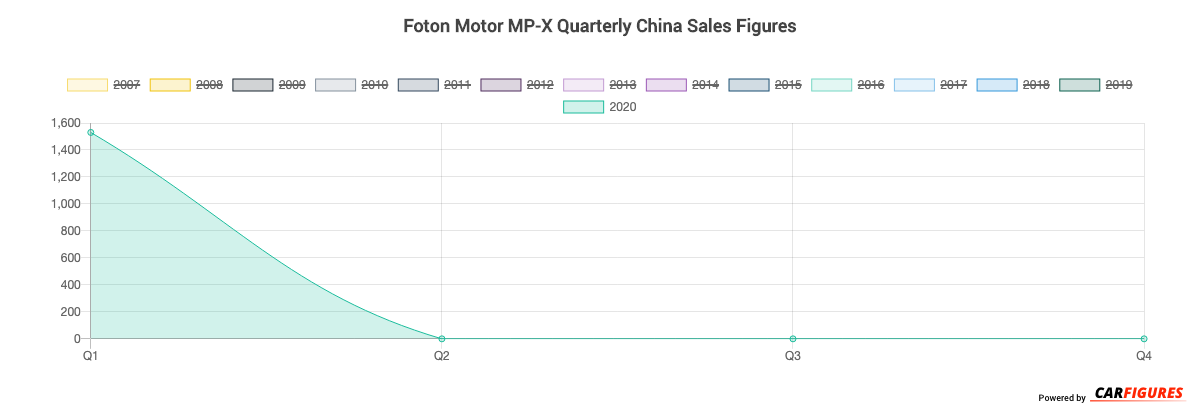
| 2020 | 1,530 | - | - | - |
| Total | 19,696 | 19,292 | 18,384 | 17,710 |
Loading, please wait
Year | Sales |
|---|---|
| 2020 | 1,530 |
| 2019 | 7,710 |
| 2018 | 7,445 |
| 2017 | 7,702 |
| 2016 | 5,633 |
| 2015 | 5,429 |
| 2014 | 6,459 |
| 2013 | 6,570 |
| 2012 | 4,187 |
| 2011 | 3,168 |
| 2010 | 4,609 |
| 2009 | 11,194 |
| 2008 | 2,710 |
| 2007 | 736 |
| Total | 75,082 |
Download Historic Sales Data

Embedded Code
See more widgetsSources: Manufacturers