Key Stats
How many Tiggo 5 did Chery sell in 2020?
Chery sold 2,838 Tiggo 5 in 2020. (From Jan - Dec 2020)
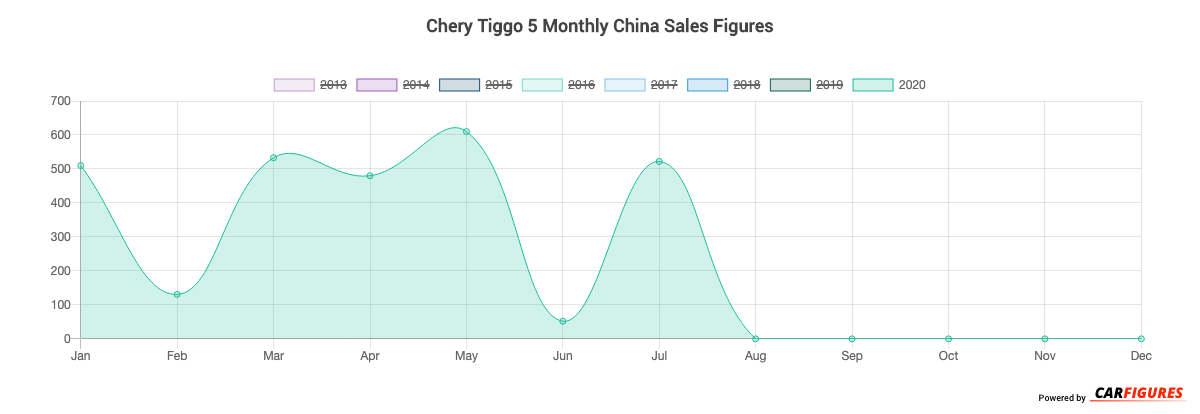
How many Tiggo 5 did Chery sell in July 2020?
Chery sold 522 Tiggo 5 in July 2020.
How many Tiggo 5 did Chery sell in 2019?
Chery sold 3,354 Tiggo 5 in 2019. In 2018, Chery sold 16,349 Tiggo 5. They sold 12,995 more units in year 2018 compared to 2019 with a percent loss of 79.48% YoY.
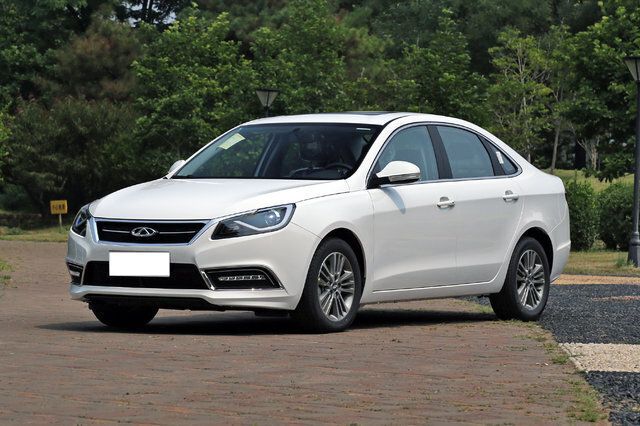
Overview
The Tiggo 5 is a 5 doors 5 seats SUV with room for 5 people from automaker Chery.
How Much Does the Chery Tiggo 5 Cost?
Pricing for the Tiggo 5 starts at CN¥88,800 Yuan ($12,432 USD) MSRP and goes up to CN¥123,800 Yuan ($17,332 USD) fully equipped.
Chery Tiggo 5 Engine and Performance
Tiggo 5 is powered by a 1.5TL engine that makes 112 Kw (150.19 HP) - 112 Kw (150.19 HP) and 205 Nm (151.70 ft-lb) - 205 Nm (151.70 ft-lb) torque.
Chery Tiggo 5 Specifications
The Tiggo 5 has a curb weight of 1,500 kg (3,300 lbs) - 1,500 kg (3,400 lbs).
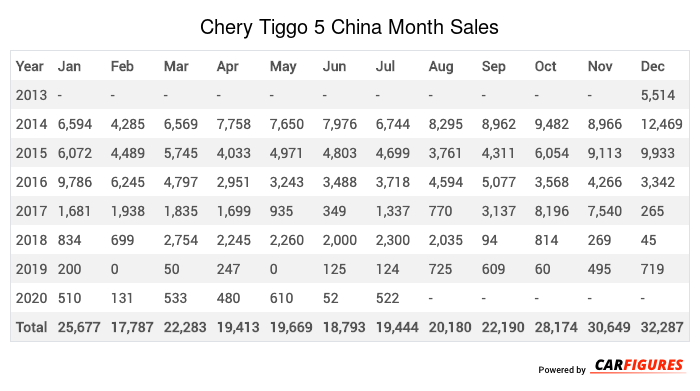
Chery Tiggo 5 China Sale figures by year, quarter, and month are presented below. Including the most up to date sales data for the Chery Tiggo 5.
Year | Jan | Feb | Mar | Apr | May | Jun | Jul | Aug | Sep | Oct | Nov | Dec |
|---|---|---|---|---|---|---|---|---|---|---|---|---|
| 2013 | - | - | - | - | - | - | - | - | - | - | - | 5,514 |
| 2014 | 6,594 | 4,285 | 6,569 | 7,758 | 7,650 | 7,976 | 6,744 | 8,295 | 8,962 | 9,482 | 8,966 | 12,469 |
| 2015 | 6,072 | 4,489 | 5,745 | 4,033 | 4,971 | 4,803 | 4,699 | 3,761 | 4,311 | 6,054 | 9,113 | 9,933 |
| 2016 | 9,786 | 6,245 | 4,797 | 2,951 | 3,243 | 3,488 | 3,718 | 4,594 | 5,077 | 3,568 | 4,266 | 3,342 |
| 2017 | 1,681 | 1,938 | 1,835 | 1,699 | 935 | 349 | 1,337 | 770 | 3,137 | 8,196 | 7,540 | 265 |
| 2018 | 834 | 699 | 2,754 | 2,245 | 2,260 | 2,000 | 2,300 | 2,035 | 94 | 814 | 269 | 45 |
| 2019 | 200 | 0 | 50 | 247 | 0 | 125 | 124 | 725 | 609 | 60 | 495 | 719 |
| 2020 | 510 | 131 | 533 | 480 | 610 | 52 | 522 | - | - | - | - | - |
| Total | 25,677 | 17,787 | 22,283 | 19,413 | 19,669 | 18,793 | 19,444 | 20,180 | 22,190 | 28,174 | 30,649 | 32,287 |
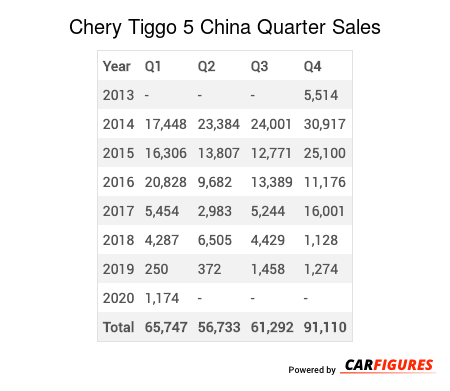
Year | Q1 | Q2 | Q3 | Q4 |
|---|---|---|---|---|
| 2013 | - | - | - | 5,514 |
| 2014 | 17,448 | 23,384 | 24,001 | 30,917 |
| 2015 | 16,306 | 13,807 | 12,771 | 25,100 |
| 2016 | 20,828 | 9,682 | 13,389 | 11,176 |
| 2017 | 5,454 | 2,983 | 5,244 | 16,001 |
| 2018 | 4,287 | 6,505 | 4,429 | 1,128 |
| 2019 | 250 | 372 | 1,458 | 1,274 |
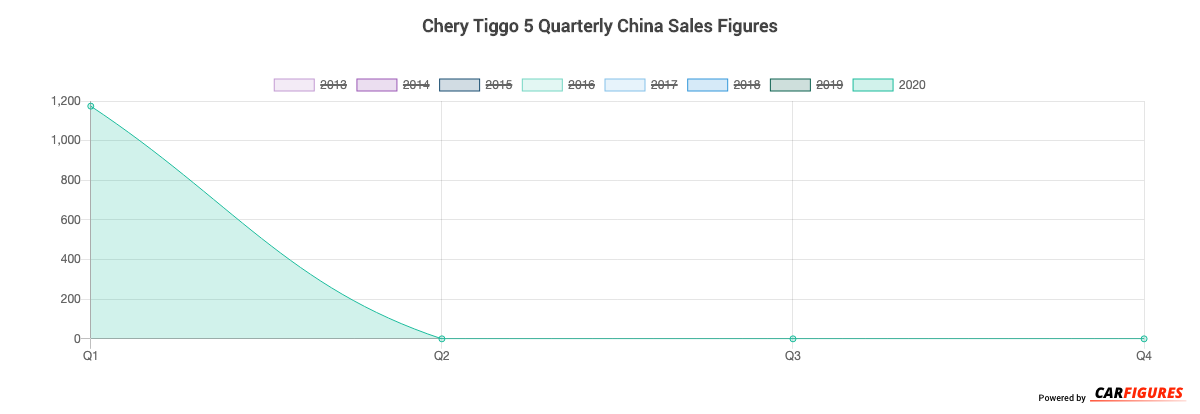
| 2020 | 1,174 | - | - | - |
| Total | 65,747 | 56,733 | 61,292 | 91,110 |
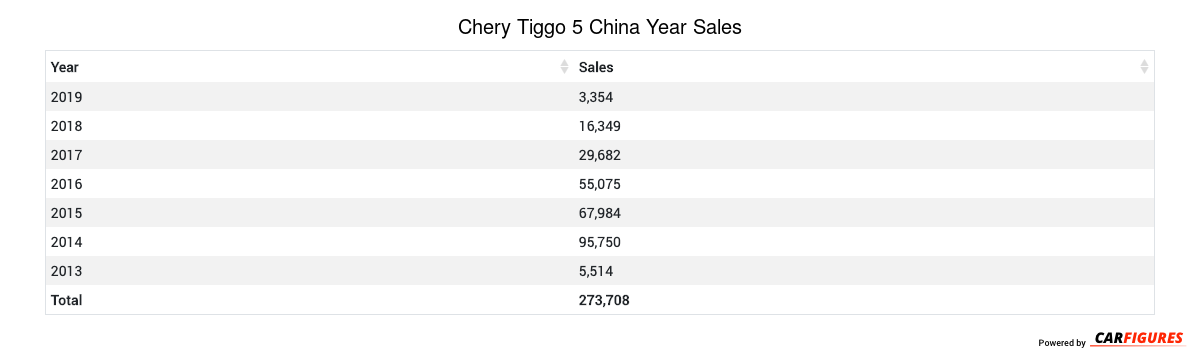
Year | Sales |
|---|---|
| 2020 | 1,174 |
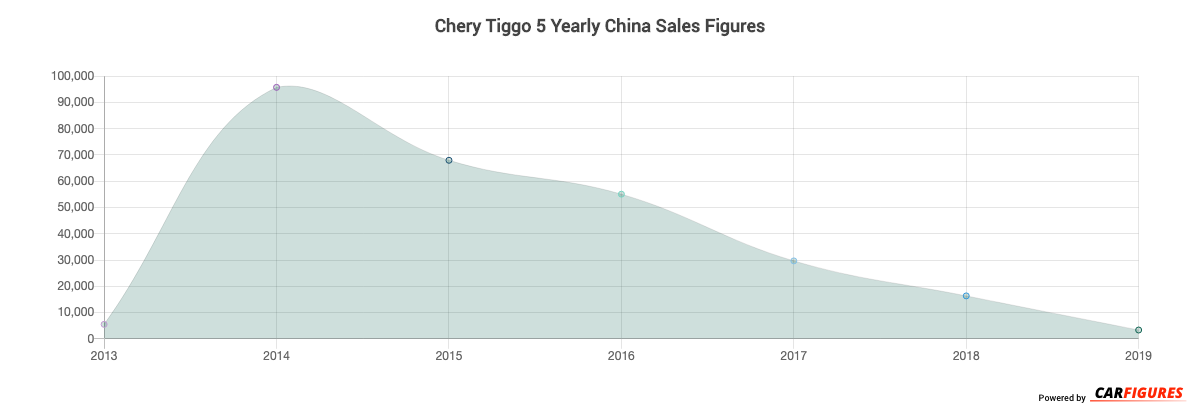
| 2019 | 3,354 |
| 2018 | 16,349 |
| 2017 | 29,682 |
| 2016 | 55,075 |
| 2015 | 67,984 |
| 2014 | 95,750 |
| 2013 | 5,514 |
| Total | 274,882 |
Download Historic Sales Data
Embedded Code
See more widgetsSources: Manufacturers