Key Stats
How many V3 did Changan sell in 2020?
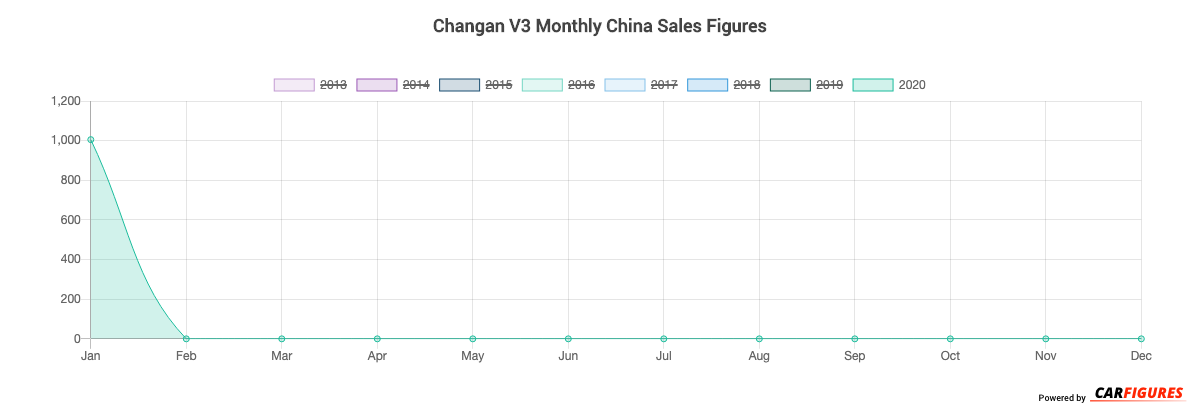
Changan sold 1,005 V3 in 2020. (From Jan - Dec 2020)
How many V3 did Changan sell in January 2020?
Changan sold 1,005 V3 in January 2020.
How many V3 did Changan sell in 2019?
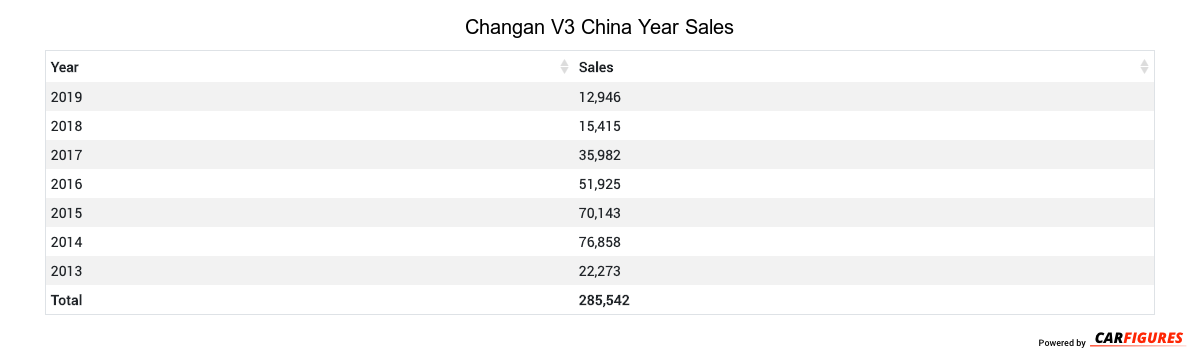
Changan sold 12,946 V3 in 2019. In 2018, Changan sold 15,415 V3. They sold 2,469 more units in year 2018 compared to 2019 with a percent loss of 16.02% YoY.
Overview
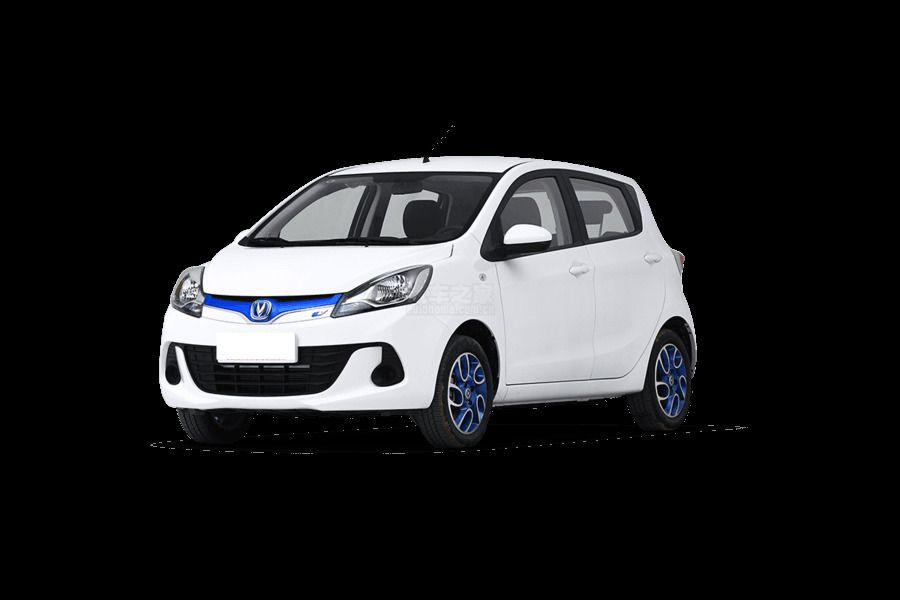
The V3 is a vehicle from automaker Changan.
How Much Does the Changan V3 Cost?
The V3 starts at CN¥43,900 Yuan ($6,146 USD) MSRP. Fully equipped, the V3 will cost you about CN¥52,900 Yuan ($7,406 USD).
Changan V3 Engine and Performance
V3 includes a 1.3L engine. This delivers 69 Kw (92.53 HP) - 74 Kw (99.24 HP) and 121 Nm (89.54 ft-lb) - 135 Nm (99.90 ft-lb) torque.
Changan V3 Specifications
The V3 has a curb weight of 990 kg (2,200 lbs) - 990 kg (2,200 lbs).
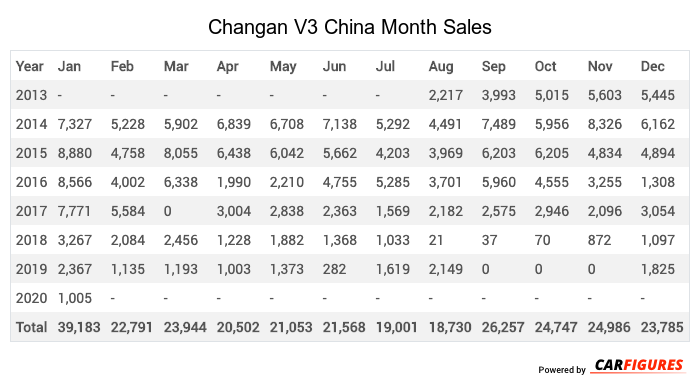
Changan V3 China Sale figures by year, quarter, and month are presented below. Including the most up to date sales data for the Changan V3.
Year | Jan | Feb | Mar | Apr | May | Jun | Jul | Aug | Sep | Oct | Nov | Dec |
|---|---|---|---|---|---|---|---|---|---|---|---|---|
| 2013 | - | - | - | - | - | - | - | 2,217 | 3,993 | 5,015 | 5,603 | 5,445 |
| 2014 | 7,327 | 5,228 | 5,902 | 6,839 | 6,708 | 7,138 | 5,292 | 4,491 | 7,489 | 5,956 | 8,326 | 6,162 |
| 2015 | 8,880 | 4,758 | 8,055 | 6,438 | 6,042 | 5,662 | 4,203 | 3,969 | 6,203 | 6,205 | 4,834 | 4,894 |
| 2016 | 8,566 | 4,002 | 6,338 | 1,990 | 2,210 | 4,755 | 5,285 | 3,701 | 5,960 | 4,555 | 3,255 | 1,308 |
| 2017 | 7,771 | 5,584 | 0 | 3,004 | 2,838 | 2,363 | 1,569 | 2,182 | 2,575 | 2,946 | 2,096 | 3,054 |
| 2018 | 3,267 | 2,084 | 2,456 | 1,228 | 1,882 | 1,368 | 1,033 | 21 | 37 | 70 | 872 | 1,097 |
| 2019 | 2,367 | 1,135 | 1,193 | 1,003 | 1,373 | 282 | 1,619 | 2,149 | 0 | 0 | 0 | 1,825 |
| 2020 | 1,005 | - | - | - | - | - | - | - | - | - | - | - |
| Total | 39,183 | 22,791 | 23,944 | 20,502 | 21,053 | 21,568 | 19,001 | 18,730 | 26,257 | 24,747 | 24,986 | 23,785 |
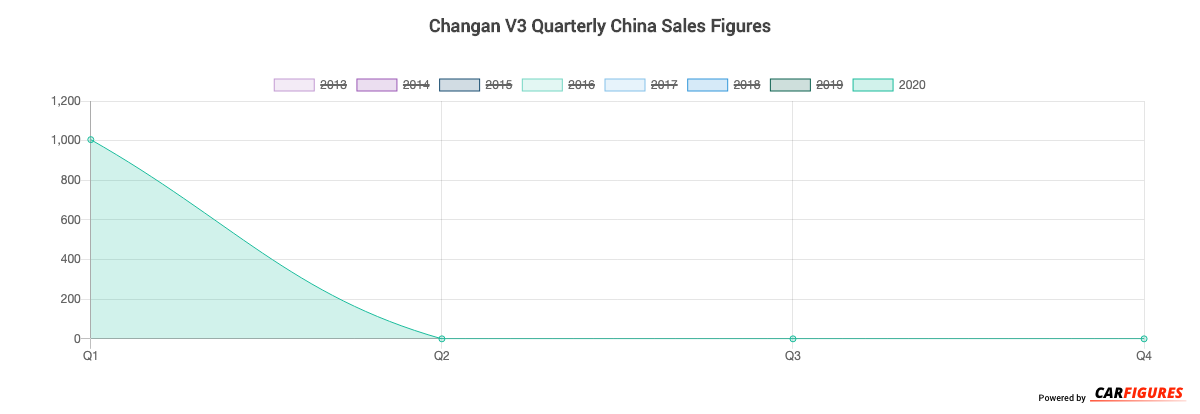
Year | Q1 | Q2 | Q3 | Q4 |
|---|---|---|---|---|
| 2013 | - | - | 6,210 | 16,063 |
| 2014 | 18,457 | 20,685 | 17,272 | 20,444 |
| 2015 | 21,693 | 18,142 | 14,375 | 15,933 |
| 2016 | 18,906 | 8,955 | 14,946 | 9,118 |
| 2017 | 13,355 | 8,205 | 6,326 | 8,096 |
| 2018 | 7,807 | 4,478 | 1,091 | 2,039 |
| 2019 | 4,695 | 2,658 | 3,768 | 1,825 |
| 2020 | 1,005 | - | - | - |
| Total | 85,918 | 63,123 | 63,988 | 73,518 |
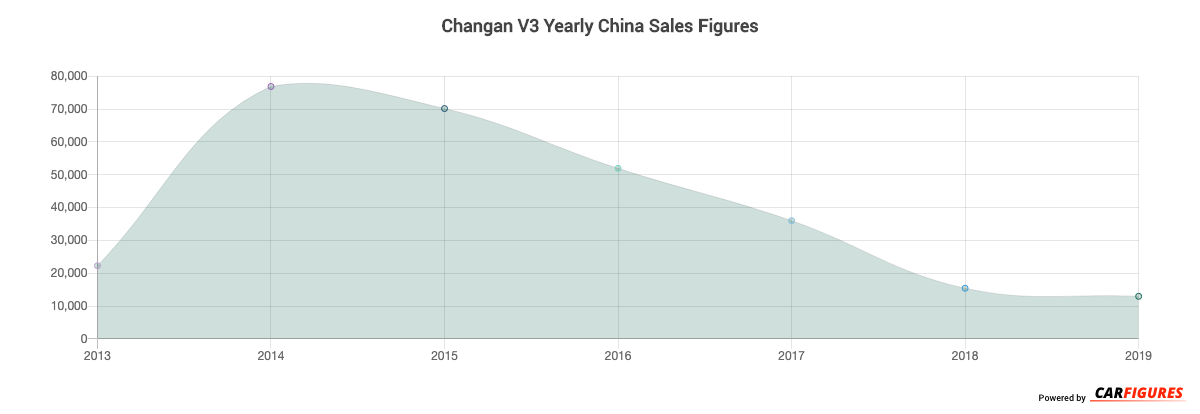
Year | Sales |
|---|---|
| 2020 | 1,005 |
| 2019 | 12,946 |
| 2018 | 15,415 |
| 2017 | 35,982 |
| 2016 | 51,925 |
| 2015 | 70,143 |
| 2014 | 76,858 |
| 2013 | 22,273 |
| Total | 286,547 |
Download Historic Sales Data

Embedded Code
See more widgetsSources: Manufacturers