Key Stats
How many CS75 did Changan sell in 2020?
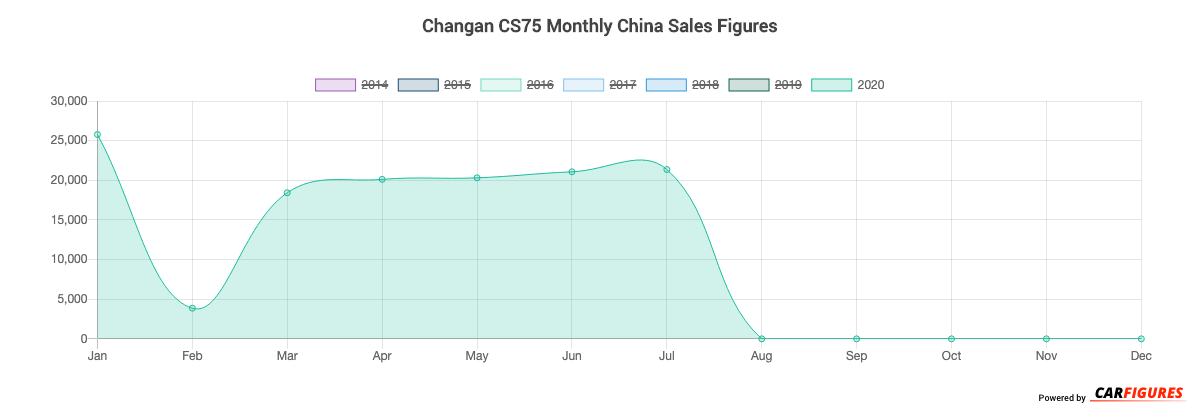
Changan sold 130,911 CS75 in 2020. (From Jan - Dec 2020)
How many CS75 did Changan sell in July 2020?
Changan sold 21,358 CS75 in July 2020.
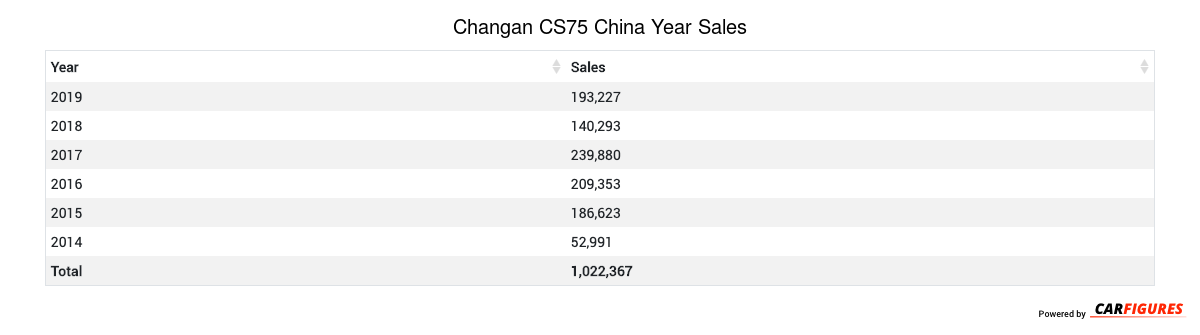
How many CS75 did Changan sell in 2019?
Changan sold 193,227 CS75 in 2019. In 2018, Changan sold 140,293 CS75. They sold 52,934 more units in 2019 compared to 2018 with a percent gain of 37.73% YoY.
Overview
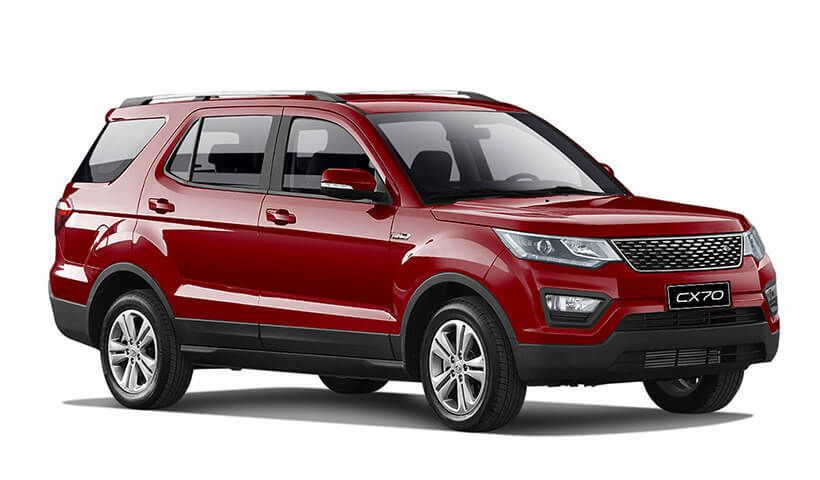
The CS75 is a 5 doors 5 seats SUV with room for 5 people from automaker Changan.
How Much Does the Changan CS75 Cost?
Pricing for the CS75 starts at CN¥92,800 Yuan ($12,992 USD) MSRP and goes up to CN¥184,800 Yuan ($25,872 USD) fully equipped.
Changan CS75 Engine and Performance
CS75 includes a 2.0LL engine. This delivers 116 Kw (155.56 HP) - 131 Kw (175.67 HP) and 200 Nm (148.00 ft-lb) - 265 Nm (196.10 ft-lb) torque.
Changan CS75 Specifications
The CS75 has a curb weight of 1,600 kg (3,600 lbs) - 1,800 kg (3,900 lbs).
Changan CS75 China Sale figures by year, quarter, and month are presented below. Including the most up to date sales data for the Changan CS75.
Year | Jan | Feb | Mar | Apr | May | Jun | Jul | Aug | Sep | Oct | Nov | Dec |
|---|---|---|---|---|---|---|---|---|---|---|---|---|
| 2014 | - | - | 31 | 338 | 1,758 | 3,844 | 5,310 | 5,772 | 9,239 | 10,347 | 10,031 | 6,321 |
| 2015 | 15,739 | 10,111 | 15,884 | 14,382 | 15,113 | 15,680 | 11,195 | 12,903 | 16,556 | 17,948 | 20,812 | 20,300 |
| 2016 | 27,148 | 16,888 | 22,037 | 10,663 | 11,495 | 8,624 | 6,737 | 15,017 | 24,820 | 23,790 | 21,978 | 20,156 |
| 2017 | 26,492 | 20,654 | 22,875 | 9,545 | 11,058 | 15,460 | 14,815 | 18,854 | 26,581 | 25,486 | 26,456 | 21,604 |
| 2018 | 21,162 | 12,616 | 15,278 | 10,292 | 9,213 | 8,630 | 6,814 | 7,810 | 13,849 | 14,980 | 12,036 | 7,613 |
| 2019 | 16,519 | 11,297 | 13,804 | 7,688 | 7,623 | 12,049 | 10,953 | 12,075 | 20,190 | 25,189 | 27,220 | 28,620 |
| 2020 | 25,773 | 3,866 | 18,424 | 20,113 | 20,307 | 21,070 | 21,358 | - | - | - | - | - |
| Total | 132,833 | 75,432 | 108,333 | 73,021 | 76,567 | 85,357 | 77,182 | 72,431 | 111,235 | 117,740 | 118,533 | 104,614 |
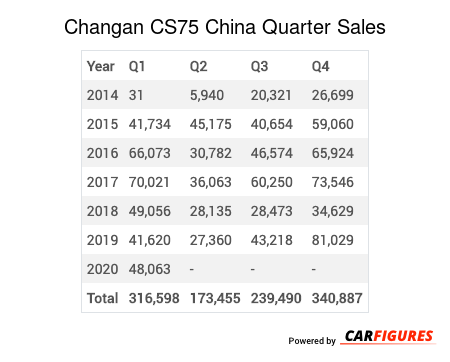
Year | Q1 | Q2 | Q3 | Q4 |
|---|---|---|---|---|
| 2014 | 31 | 5,940 | 20,321 | 26,699 |
| 2015 | 41,734 | 45,175 | 40,654 | 59,060 |
| 2016 | 66,073 | 30,782 | 46,574 | 65,924 |
| 2017 | 70,021 | 36,063 | 60,250 | 73,546 |
| 2018 | 49,056 | 28,135 | 28,473 | 34,629 |
| 2019 | 41,620 | 27,360 | 43,218 | 81,029 |
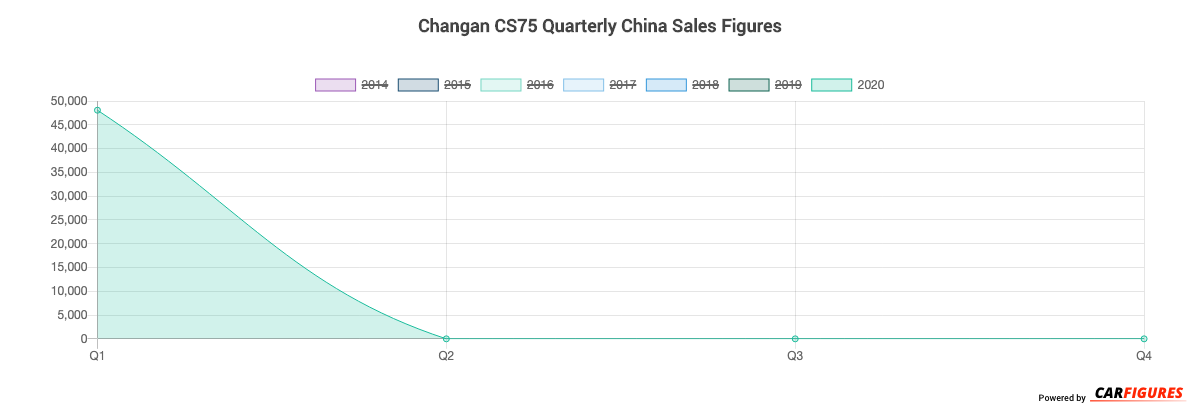
| 2020 | 48,063 | - | - | - |
| Total | 316,598 | 173,455 | 239,490 | 340,887 |
Year | Sales |
|---|---|
| 2020 | 48,063 |
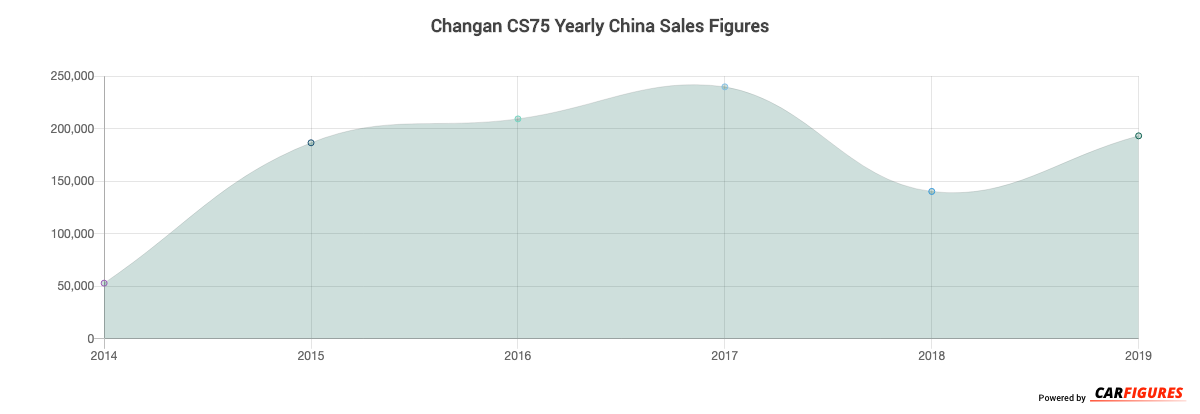
| 2019 | 193,227 |
| 2018 | 140,293 |
| 2017 | 239,880 |
| 2016 | 209,353 |
| 2015 | 186,623 |
| 2014 | 52,991 |
| Total | 1,070,430 |
Download Historic Sales Data

Embedded Code
See more widgetsSources: Manufacturers