Key Stats
How many CS15 did Changan sell in 2020?
Changan sold 4,378 CS15 in 2020. (From Jan - Dec 2020)
How many CS15 did Changan sell in July 2020?
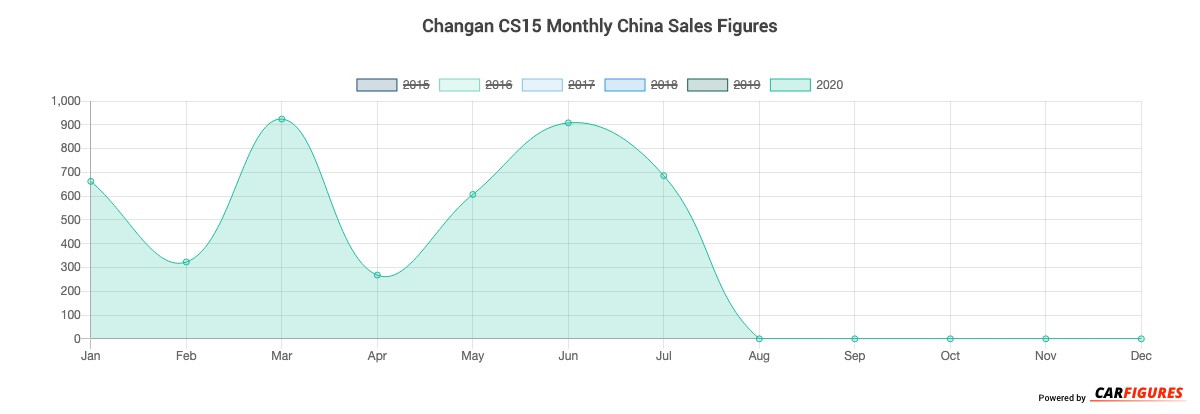
Changan sold 686 CS15 in July 2020.
How many CS15 did Changan sell in 2019?
Changan sold 20,095 CS15 in 2019. In 2018, Changan sold 26,724 CS15. They sold 6,629 more units in year 2018 compared to 2019 with a percent loss of 24.81% YoY.
Overview
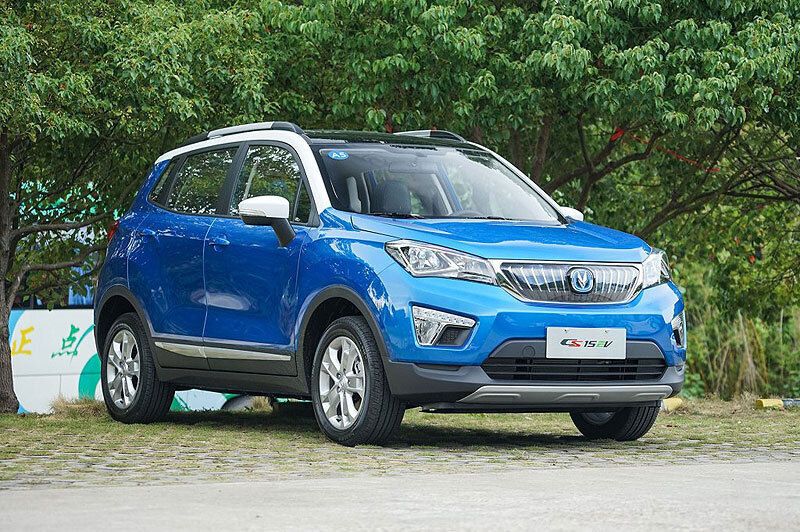
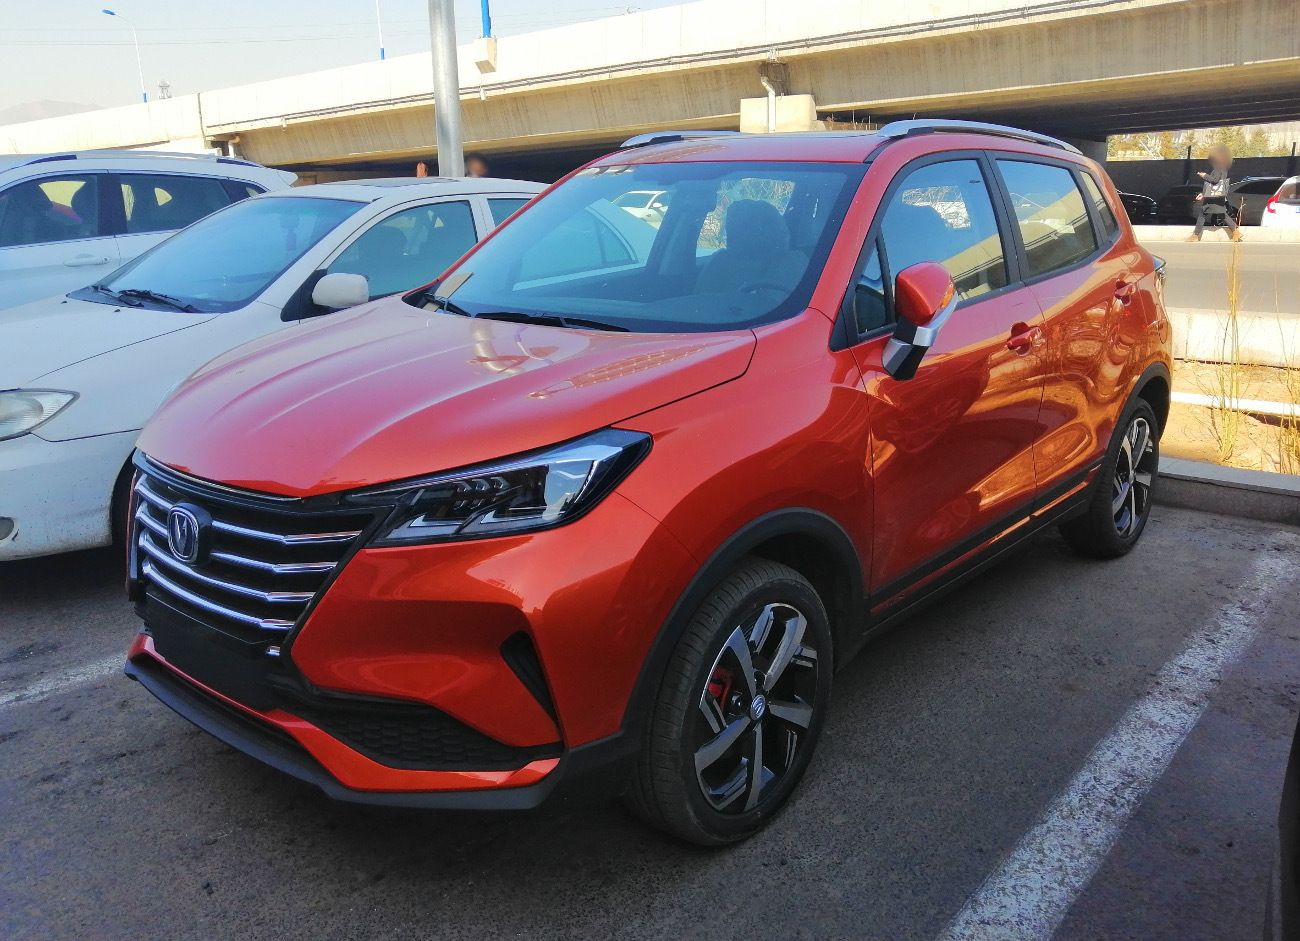
The CS15 is a 5 doors 5 seats SUV with room for 5 people from automaker Changan.
How Much Does the Changan CS15 Cost?
Pricing for the CS15 starts at CN¥55,900 Yuan ($7,826 USD) MSRP and goes up to CN¥78,900 Yuan ($11,046 USD) fully equipped.
Changan CS15 Engine and Performance
CS15 is powered by a 1.5LL engine that makes 78. 5 Kw (105. 27 HP) - 78. 5 Kw (105. 27 HP) and 145 Nm (107.30 ft-lb) - 145 Nm (107.30 ft-lb) torque.
Changan CS15 Specifications
The CS15 has a curb weight of 1,200 kg (2,700 lbs) - 1,200 kg (2,700 lbs).
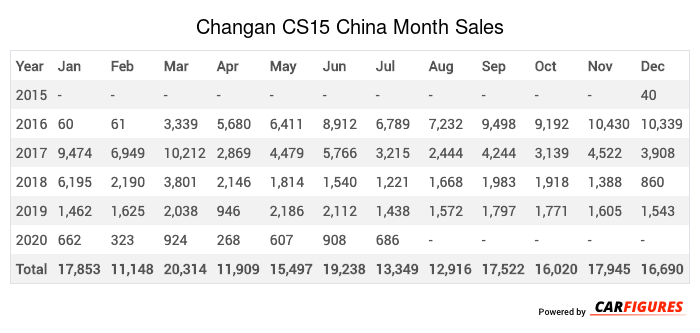
Changan CS15 China Sale figures by year, quarter, and month are presented below. Including the most up to date sales data for the Changan CS15.
Year | Jan | Feb | Mar | Apr | May | Jun | Jul | Aug | Sep | Oct | Nov | Dec |
|---|---|---|---|---|---|---|---|---|---|---|---|---|
| 2015 | - | - | - | - | - | - | - | - | - | - | - | 40 |
| 2016 | 60 | 61 | 3,339 | 5,680 | 6,411 | 8,912 | 6,789 | 7,232 | 9,498 | 9,192 | 10,430 | 10,339 |
| 2017 | 9,474 | 6,949 | 10,212 | 2,869 | 4,479 | 5,766 | 3,215 | 2,444 | 4,244 | 3,139 | 4,522 | 3,908 |
| 2018 | 6,195 | 2,190 | 3,801 | 2,146 | 1,814 | 1,540 | 1,221 | 1,668 | 1,983 | 1,918 | 1,388 | 860 |
| 2019 | 1,462 | 1,625 | 2,038 | 946 | 2,186 | 2,112 | 1,438 | 1,572 | 1,797 | 1,771 | 1,605 | 1,543 |
| 2020 | 662 | 323 | 924 | 268 | 607 | 908 | 686 | - | - | - | - | - |
| Total | 17,853 | 11,148 | 20,314 | 11,909 | 15,497 | 19,238 | 13,349 | 12,916 | 17,522 | 16,020 | 17,945 | 16,690 |
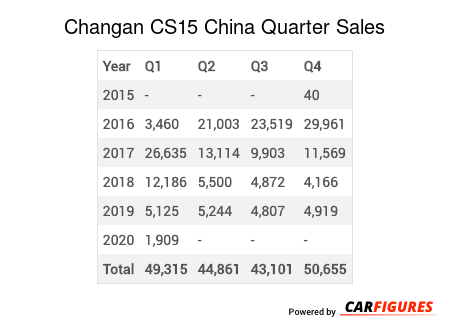
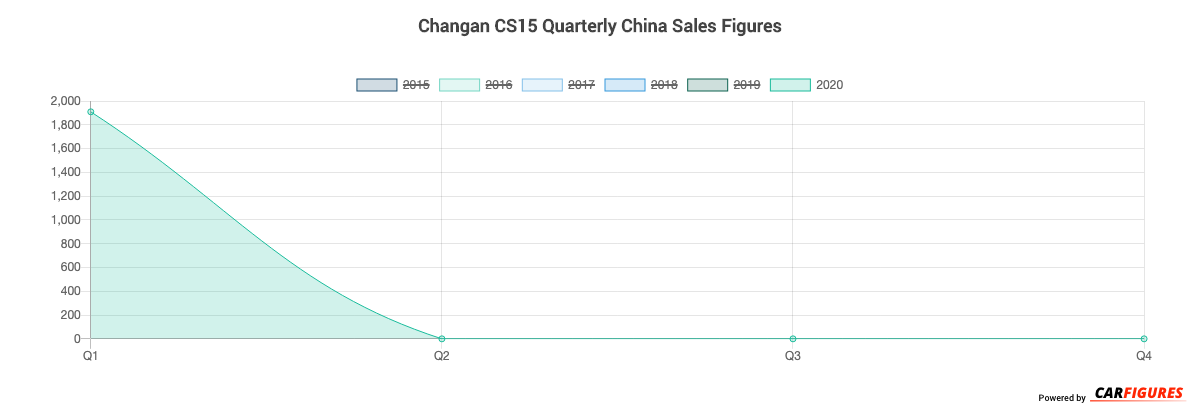
Year | Q1 | Q2 | Q3 | Q4 |
|---|---|---|---|---|
| 2015 | - | - | - | 40 |
| 2016 | 3,460 | 21,003 | 23,519 | 29,961 |
| 2017 | 26,635 | 13,114 | 9,903 | 11,569 |
| 2018 | 12,186 | 5,500 | 4,872 | 4,166 |
| 2019 | 5,125 | 5,244 | 4,807 | 4,919 |
| 2020 | 1,909 | - | - | - |
| Total | 49,315 | 44,861 | 43,101 | 50,655 |
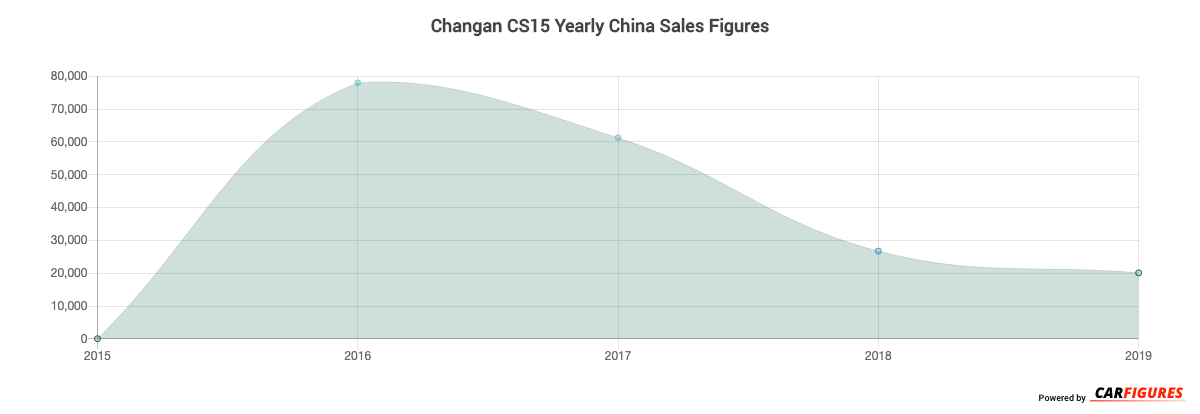
Year | Sales |
|---|---|
| 2020 | 1,909 |
| 2019 | 20,095 |
| 2018 | 26,724 |
| 2017 | 61,221 |
| 2016 | 77,943 |
| 2015 | 40 |
| Total | 187,932 |
Download Historic Sales Data

Embedded Code
See more widgetsSources: Manufacturers